Statistical forecasting is probably the most wrongly applied analytical technique in history. When applied right it can function as a strong quantitative baseline for your forecasting and decision-making processes. However, be cautious when using traditional statistical forecasting techniques in case of significant sales turning points in your data.
Put simply, statistical forecasting techniques are used to make predictions about the future by looking at historical data. In the context of a global manufacturing company, it is mostly used to predict future demand by looking at historical sales data. Despite the very quantitative nature of statistical forecasting techniques, one might think that developing a good forecast, boils down to selecting the best forecasting technique that has proven their worth for your type of data/industry/…
However, both researchers and practitioners understand developing a good statistical forecast can sometimes be more an art than a science. Not only is there a wide variety of techniques that you can choose from, depending on how intermittent, seasonal, … your data is, one also has to decide at which level of aggregation the forecast(s) should be calculated, and what kind of metrics should be used to measure its accuracy.
Now, here is the bad news… Even if you made all the right decisions with respect to the forecasting techniques, aggregation levels, and accuracy metrics, your forecasts will be way off in case of significant sales turning points in your data.
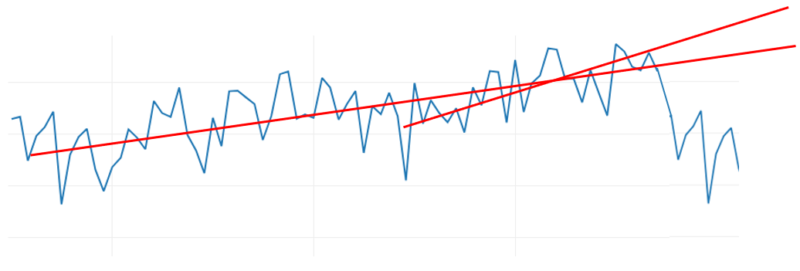
Let’s take a time series example. Imagine you have the following historical sales pattern:

The example sales pattern is quite common. It is in line with the economic situation that a lot of sectors have been in pre-202: An economy of consistent growth.
Figure 2 illustrates how traditional statistical forecasting techniques extrapolate history to predict the future. Depending on the selected technique we will take a short or a long-term trend, both will predict a further increase in the future. The short-term trend will predict a faster increase than the long-term trend.
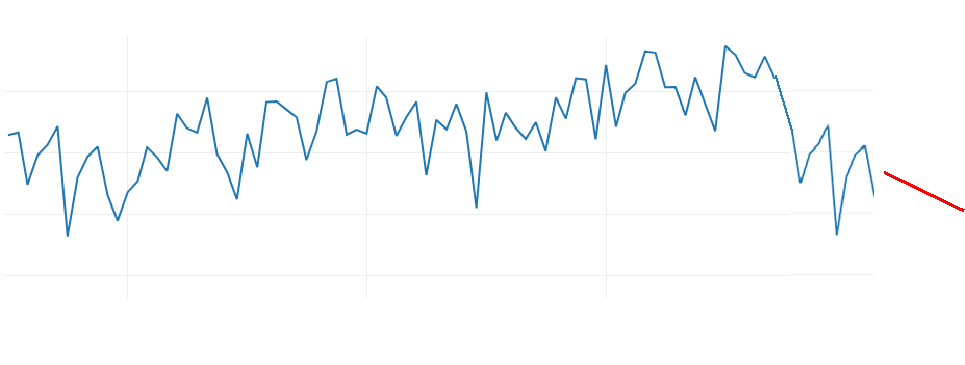
 Suppose this consistent growth is followed by a sudden decline in our sales, or a so-called “sales turning point”. At some point in time, we see our sales volumes declining. Traditional statistical forecasting techniques as such cannot predict a sales turning point in the data.
Let’s now take a look at what statistical forecasting models will do: All of a sudden instead of predicting an increase they will predict a decrease. And if you look at the short-term trend in Figure 4 they will extrapolate more aggressively all the way to the bottom, which is not necessarily very helpful either. Month after month your quantitative baseline for forecasting is changing, which creates a very nervous environment for decision-making.
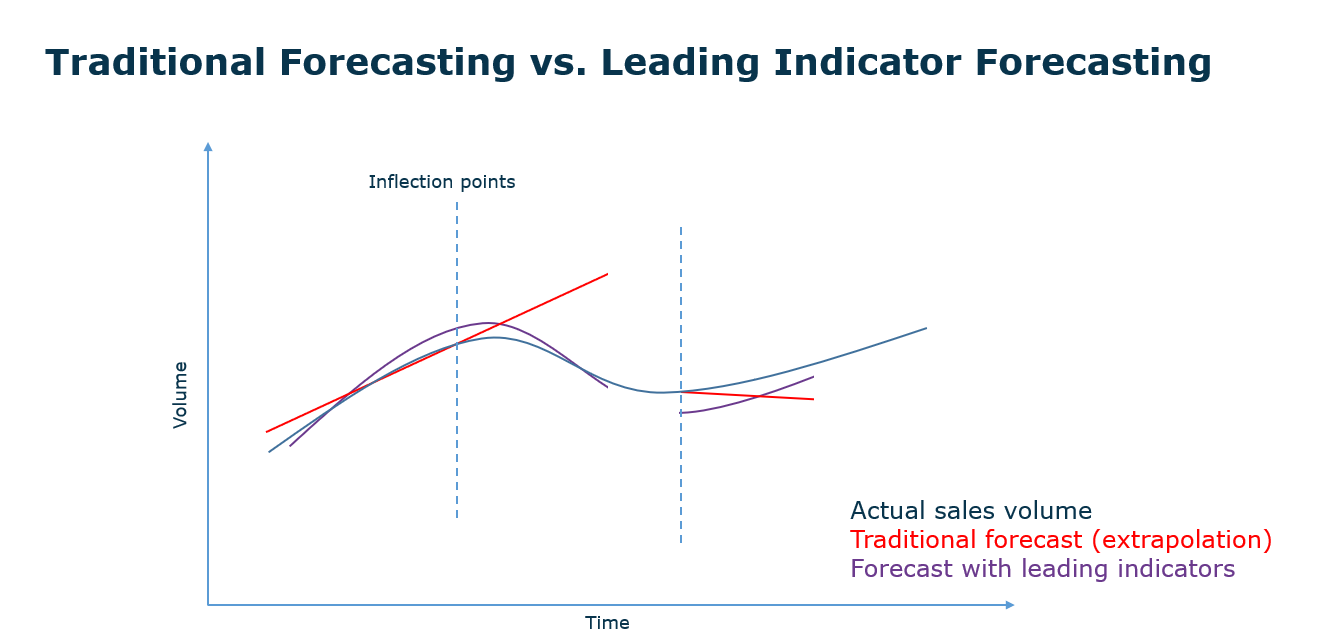
 At some point in time, the situation might stabilize, and we might see a boost again, a recovery. Again, if I’m not able to predict trend changes, I will be too late. Because at some point in time I will see a kind of recovery and if it’s not in my forecast, I won’t have the material to supply. Going forward we know that at some point in time a downward sales turning point is going to bottom out,
This allows us to arrive at the million-dollar question: how to predict sales turning points? The prediction of this trend changes is not something that can be done solely by looking at our own historical data but is an insight that should be derived by using the impact of external (macro-economic) indicators on our sales patterns.
The technique of leading indicator forecasting looks at which external indicators are making the same turning points as your sales data, only a couple of months in advance. Leading indicators forecasting techniques use those indicators with leading value for your business in order to indicate when a sales turning point is coming up.

Once we have identified this sales turning or inflection point, we can again focus on the challenge of optimally applying our traditional forecasting techniques to extrapolate short- or long-term trends, seasonality, etc. The combination of statistical forecasting techniques and leading indicators provides companies with the best possible baseline for collaborative forecasting and decision-making processes, that enables us to achieve the optimal balance between supply and demand we are all looking for today!
The following articles may also be interesting for you:
These Stories on External data