

Monitoring Update: Partly improved semiconductor shortages & faltering demand create uncertainty in end-to-end automotive supply chains
This blog builds further on our series of automotive blog posts where we monitor the supply & demand imbalances since the initial covid outbreak. Our latest blog from January originated from when the automotive industry was experiencing a full blown semiconductor shortage which had led to the demand being much larger than the available supply.
Since our latest report, the semiconductor supply situation has improved. Semiconductor shortages have improved, but are still impacting the automotive industry. However, new supply issues as a result of Russia’s invasion of Ukraine (for example VW closed 2 plants temporarily due to missing parts sourced from Ukraine) and bleak demand outlook (high inflation & energy costs, along with a potential recession) are additional headwinds in the automotive industry.
In this blog, we will provide an update on how the supply & demand picture has evolved. Furthermore we will address how you can quantify the impact and outlook as an upstream supplier in and end-to-end automotive value chain. Let’s look how both the supply and the demand evolved!
In our previous blog we identified the imbalance between demand and supply. The graph below depicts the out-of-sync behavior between vehicle sales and vehicle assemblies from the start of the COVID outbreak. Demand & supply behaved in an opposite direction, quickly depleting the available assembled vehicle inventories when demand was high in 2021.
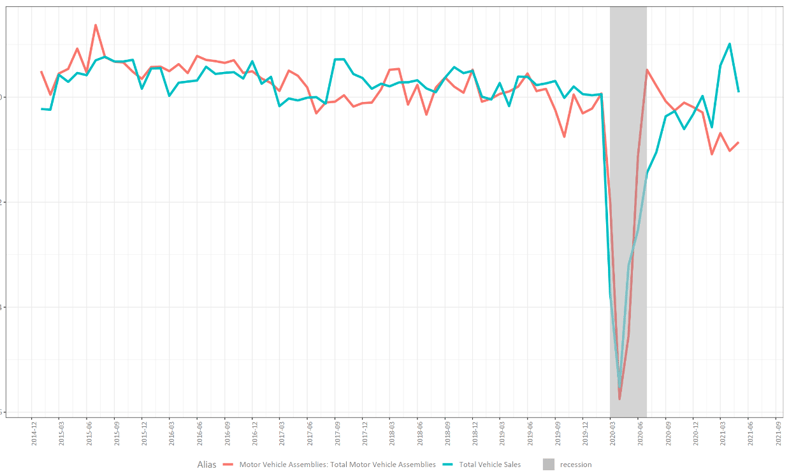
At that moment, Q2 2021, the general expectation was that the worst was already behind us. Slowly but steadily semiconductor & other shortages would get resolved and vehicle assemblies were expected to recover in Q3 & Q4. However, recovery in vehicles being assembled only started to materialize near the end of Q1 of this year.
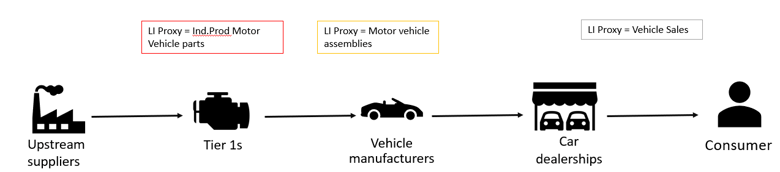
The dashboard below builds further on the monitoring we included in the previous blog. It visualizes three indicators which we use as proxies for the demand behavior in three parts of the end-to-end automotive value chain. It monitors the actual US vehicle sales to consumers, the number of cars being assembled at OEMs and the number of automotive parts being produced further upstream. The indicators have been rescaled and plotted on one chart so we can zoom in on their converging or diverging behavior.
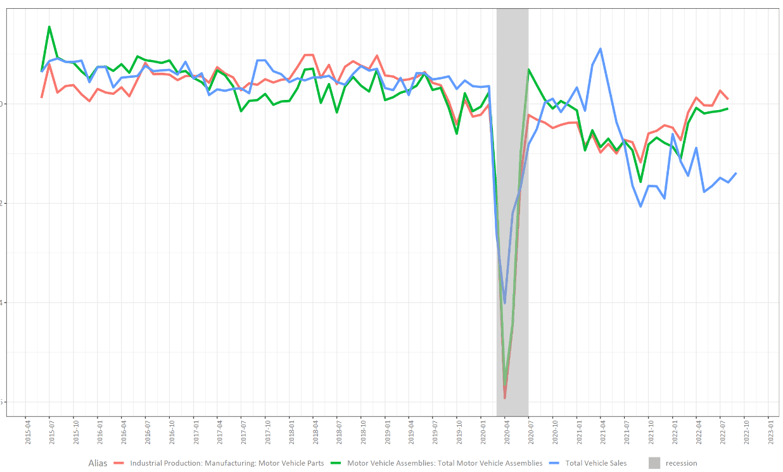
The graph shows that the indicators evolved similarly before the COVID outbreak and indicates that the end-to-end value chain was for the most part in sync. The overall trend of vehicle sales is reflected in the proxies of the upstream echelons.
After the outbreak, vehicle sales (blue) quickly recovered and reached a peak in demand in April 2021. It consecutively turned into a steep decline and did not yet reach pre-pandemic level up the latest reading (September 2022).
The car assembly (green) situation started recovering at the start of this year. The July reading even showed recovery up to pre-pandemic levels. Similarly, the production of motor vehicle parts has shown recovery to pre-pandemic levels.
These behaviors can be seen as a positive & a negative sign for the automotive industry. The recovery in production seems to indicate most of the supply issues are behind us. If automotive OEMs can sustain these levels of production in the upcoming months, production in automotive can normalize and the industry can return to normal pre-pandemic patterns after 2.5 years of chaos. On the other side, the sales of new vehicles does not show the same recovery. This gives us an indication that the demand for new vehicles is lower than previously expected!
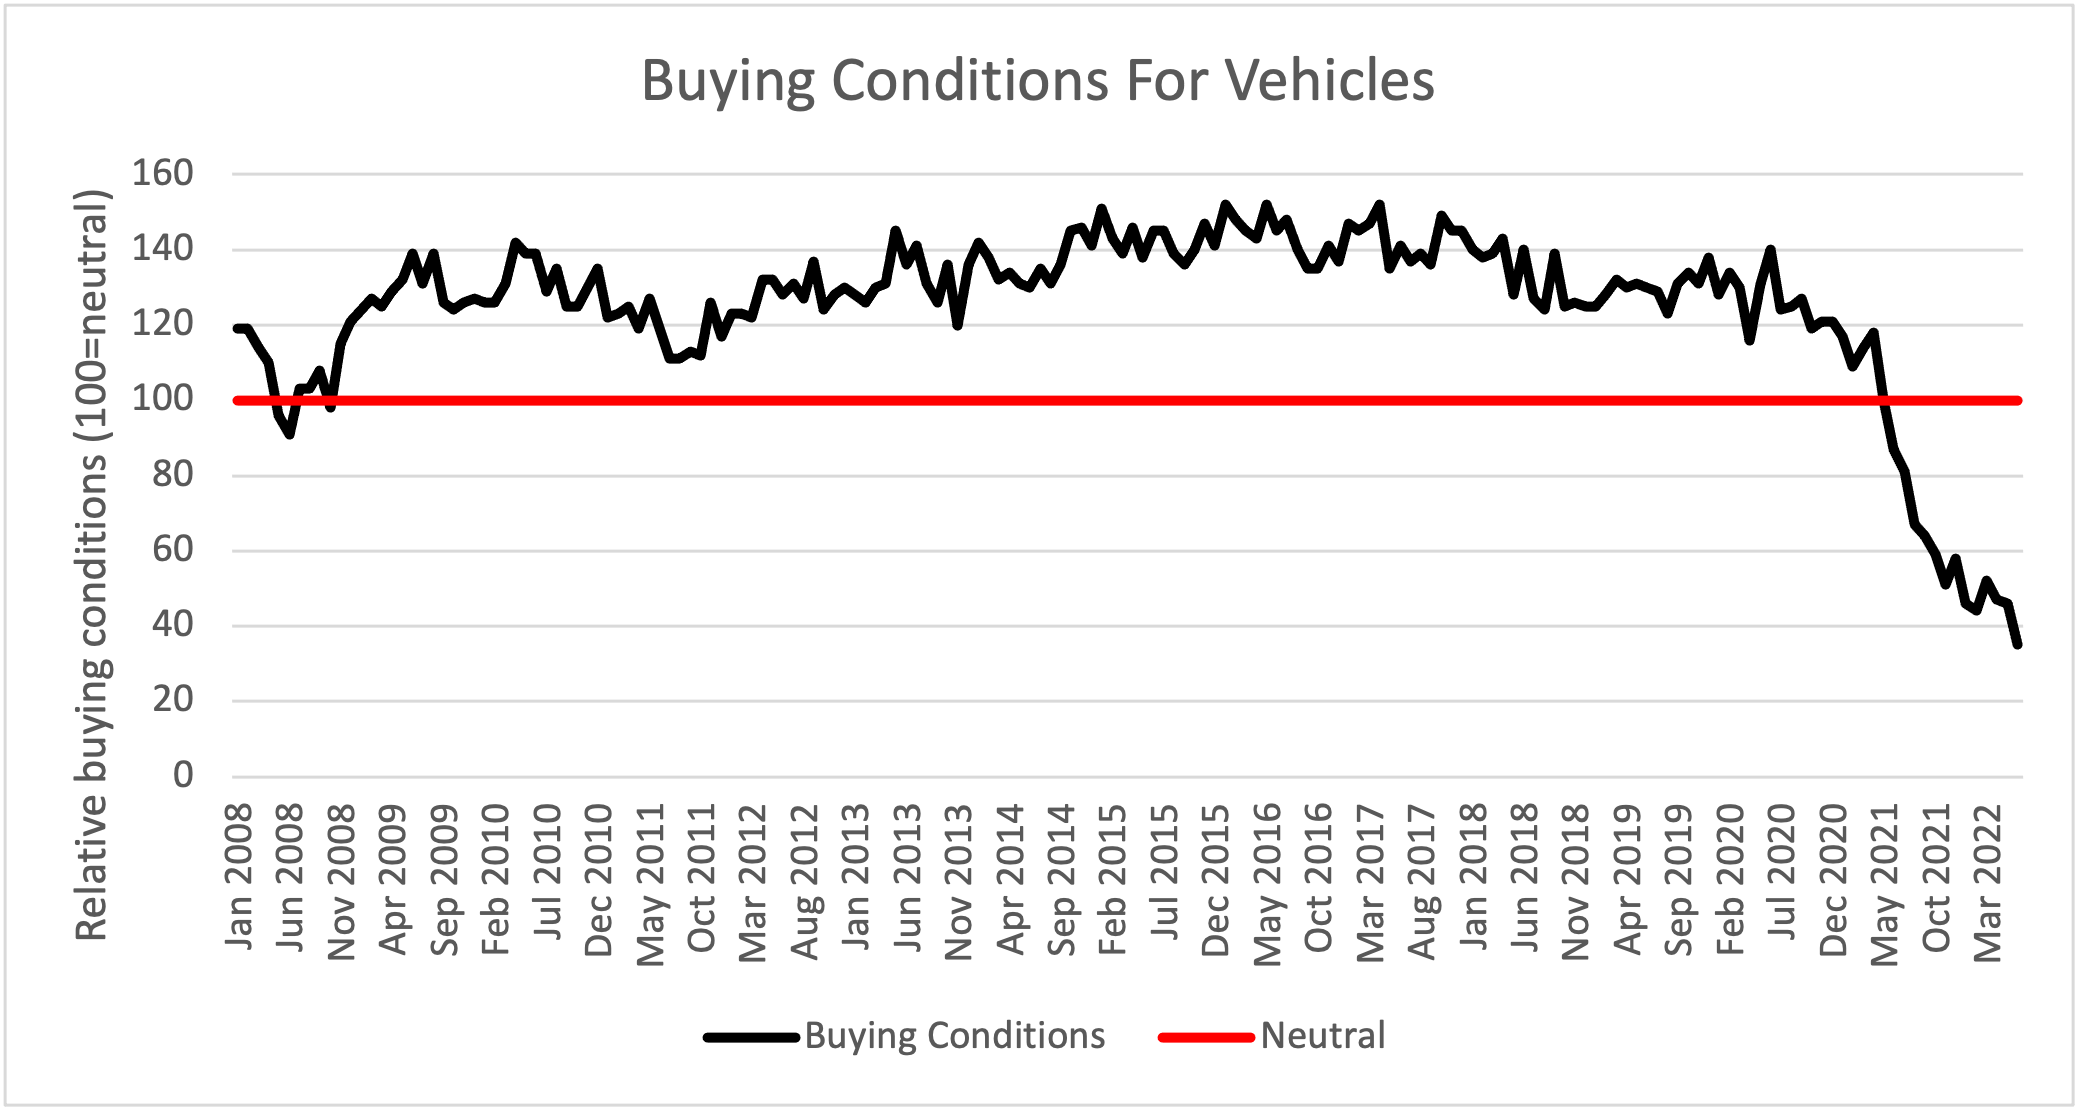
The “Surveys of Consumers” from the University of Michigan queries consumers whether they perceive the current period as a good or bad time to buy a car. Respondents give overwhelmingly negative responses, as can be seen on the graph below. The neutral line is in red. 100 represents equally positive as negative respondents. Currently the indicator is at its lowest ever sentiment, as consumers become more and more pessimistic on buying vehicles, even lower than during the financial crisis in 2008 and the pandemic outbreak in 2020. Correspondents indicate high prices for cars due to low supply as the main reason for this assessment. Other (minor) reasons include increasing interest rates & high gas prices.
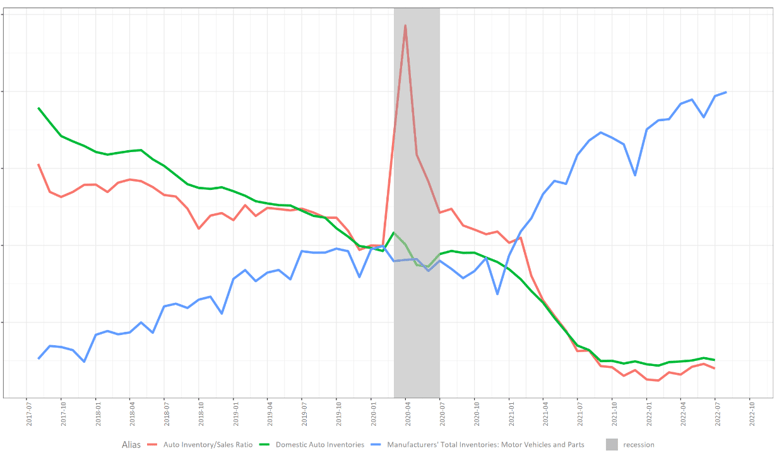
Inventory monitoring dashboards confirm the supply constraints are being resolved: inventories of assembled vehicles (green) were at an all-time low (40k finished autos, pre-COVID normal of 500k), but have recovered to 95k in July. It also confirms more and more supply finds its way to inventories, but fewer consumers are buying those new vehicles, which leads to increased inventories.
The total automotive inventories (including both vehicles & parts) have reacted to this behavior. For the first time since the pandemic the indicator has stabilized. This could mean automotive supply chains are bracing for lower demand and are lowering inventories across the automotive supply chain. For upstream automotive companies, this could result in strongly negative impact due to bull whip behavior.
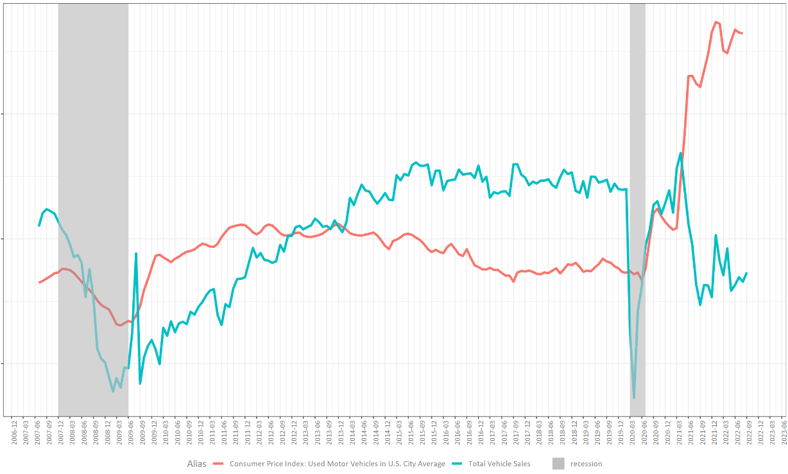
The low amount of new cars entering the market is increasingly impacting consumers. Given the law of supply and demand, the low supply situation has led to significant price increases for cars. These price increases are not only seen in new cars, but also for the (limited) supply of used cars. The graph below shows the price of used cars has increased by 50% over the past year, this increase has been occurring at a pace never seen before! While we are seeing a ramping up in the supply for new cars, we do not yet see much impact on the prices of used cars: they have stabilized since the start of the year, but have not yet decreased. If supply of new cars is truly higher than the demand, the price for used cars should adjust to this new balance. It’s possible this decrease will uncover once vehicle inventories increase more.
How will the situation evolve? After the paltry growth the automotive sector saw in 2021 due to shortages, the expectation was that 2022 will show sizable growth around the globe as supply chains recover. However, this expectation again did not materialize: supply has picked up, but the demand for cars seems muted due to a variety of reason: high prices of cars, high inflation, uncertain economic conditions and a potential recession on the horizon. We suggest to follow-up on these evolutions both on the supply and the demand side.
Monitoring the situation month-over-month is critical to keep a good insight in the evolutions across the different echelons. It’s wise to select of the most relevant indicators for your position in the value chain. Monitoring tools from Solventure LIFe collect the different indicators from public and private sources and visualize these in a convenient and intuitive way.
Solventure LIFe also assesses how your company sales is correlated with different indicators and which indicators demonstrate a leading behavior on your sales. These insights allow companies to make a forecasting model that includes evolutions from macro-economic & industry indicators. Companies create a competitive advantage to drive the discussion as part of their DMR why the bottoms-up sales forecast aligns or deviates from a macro-economic forecast including these indicators. When inflection points in company sales occur, these models give early warning signals 4 to 6 months in advance. Which sales, marketing or supply chain leader would not hugely benefit of 4 to 6 months of time to anticipate on significant demand changes?
Unsure which indicators and how indicators are impacting your business? Read all about it in our latest Ebook about anticipating sales turning points!

The following articles may also be of interest to you: