


It’s safe to say the construction market was overheating in 2021. We have seen housing prices rise to insane levels due to high demand (buyers even spend 100,000s of USD/EUR without actually seeing the building). However, price increases were not limited to the prices of houses. High prices of key raw materials (steel, lumber, energy, ..) have resulted in high costs for construction materials due to a combination of high demand & supply difficulties. Construction workers had extreme amounts of work & high backlogs.
In 2022, thunderclouds started appearing in the global economy. Inflation was no longer transitory and reached the highest levels since the 80s, which has resulted in central banks becoming more and more restrictive/hawkish to slow down economic growth and curb inflation. On top of that, war erupted in Europe straining economies further due to weaponizing of energy & disrupted supply chains. In this blog, we will evaluate how these events have impacted the US construction market. Furthermore, we will discuss what the outlook looks like for the future.
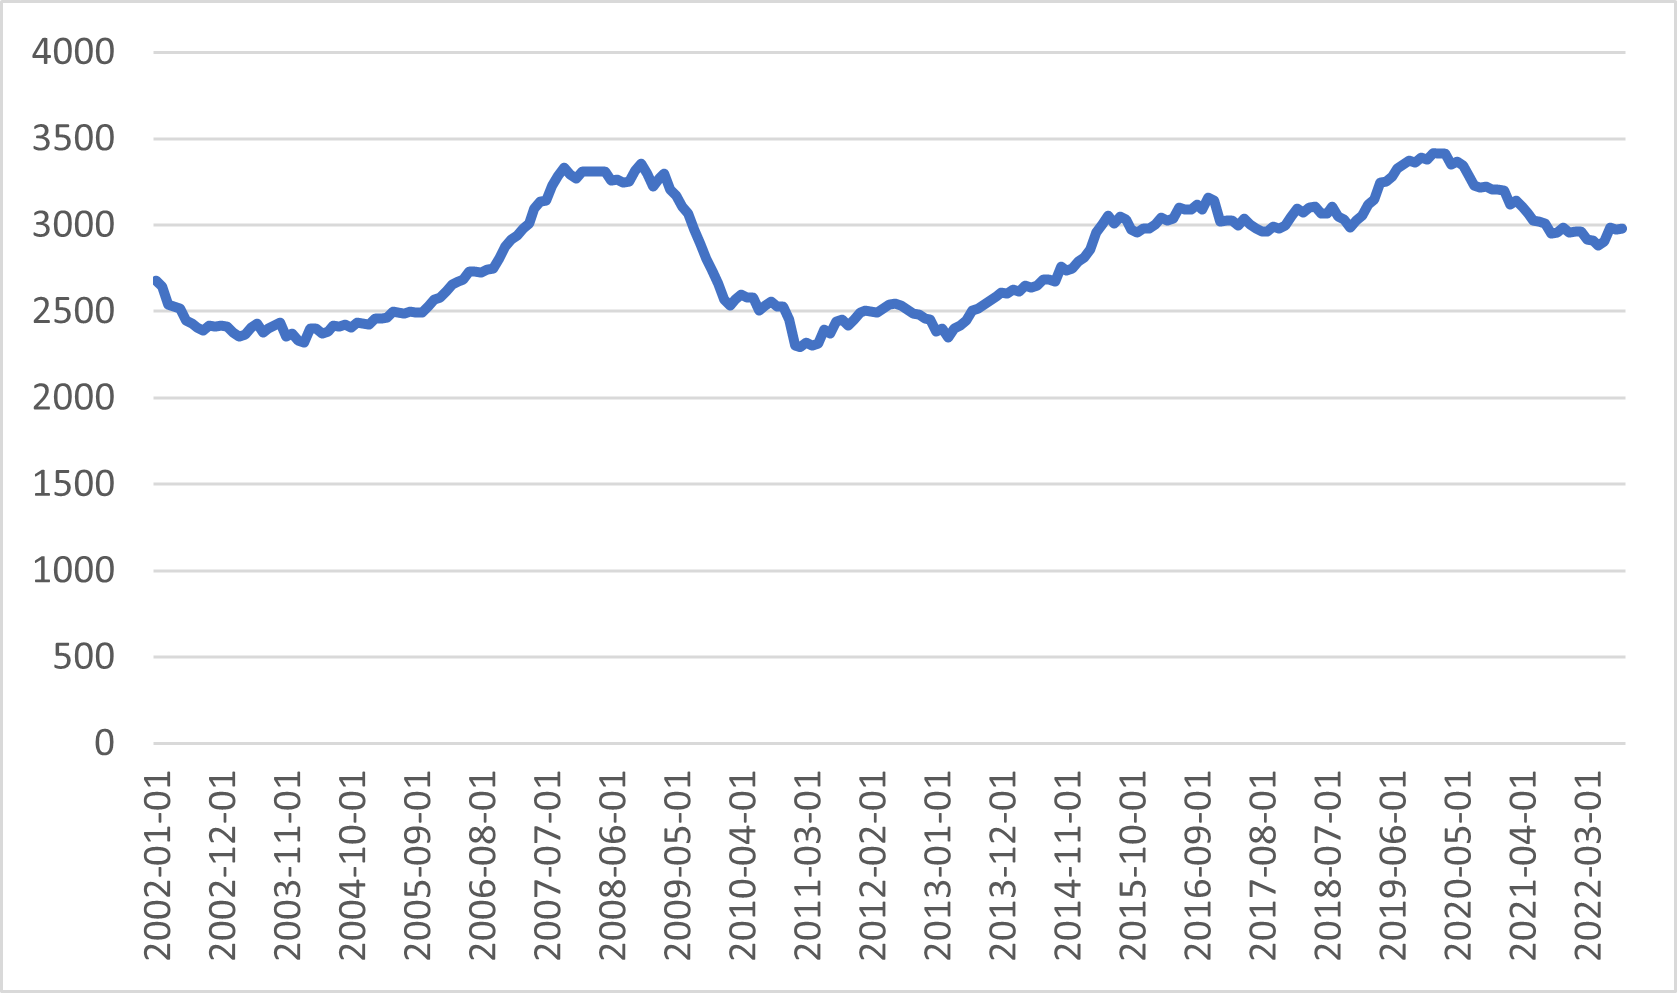
Let's first look at both residential & non-residential construction spending, which we adjusted using the consumer price index to account for inflation. We see that residential construction spending has been in an increasing trend up to May 2022, since then there has been a fallback in construction spending (albeit the decrease is only minor). For non-residential construction (accounting for inflation), spending has decreased since January 2020. The pace of residential spending growth exceeded the decrease in non-residential spending since that time, showing the total construction spending has been growing. For the construction market, it is a worrying trend that both residential & non-residential are not growing. 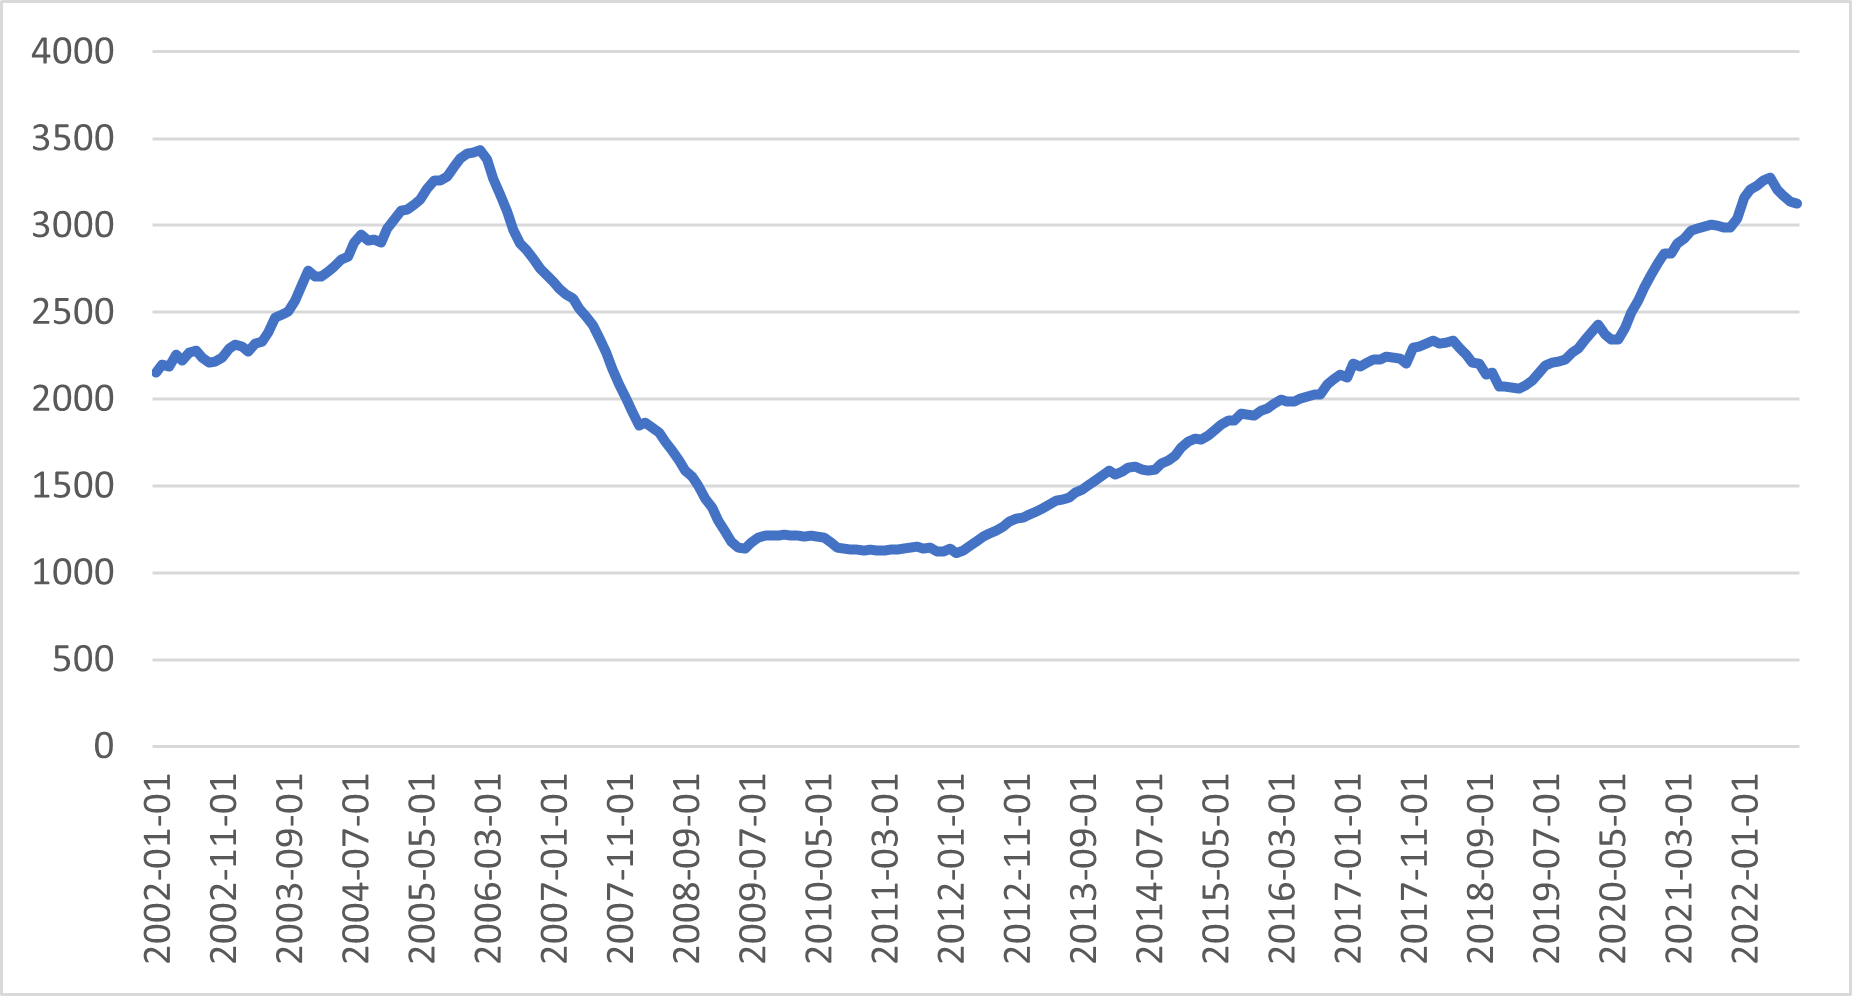
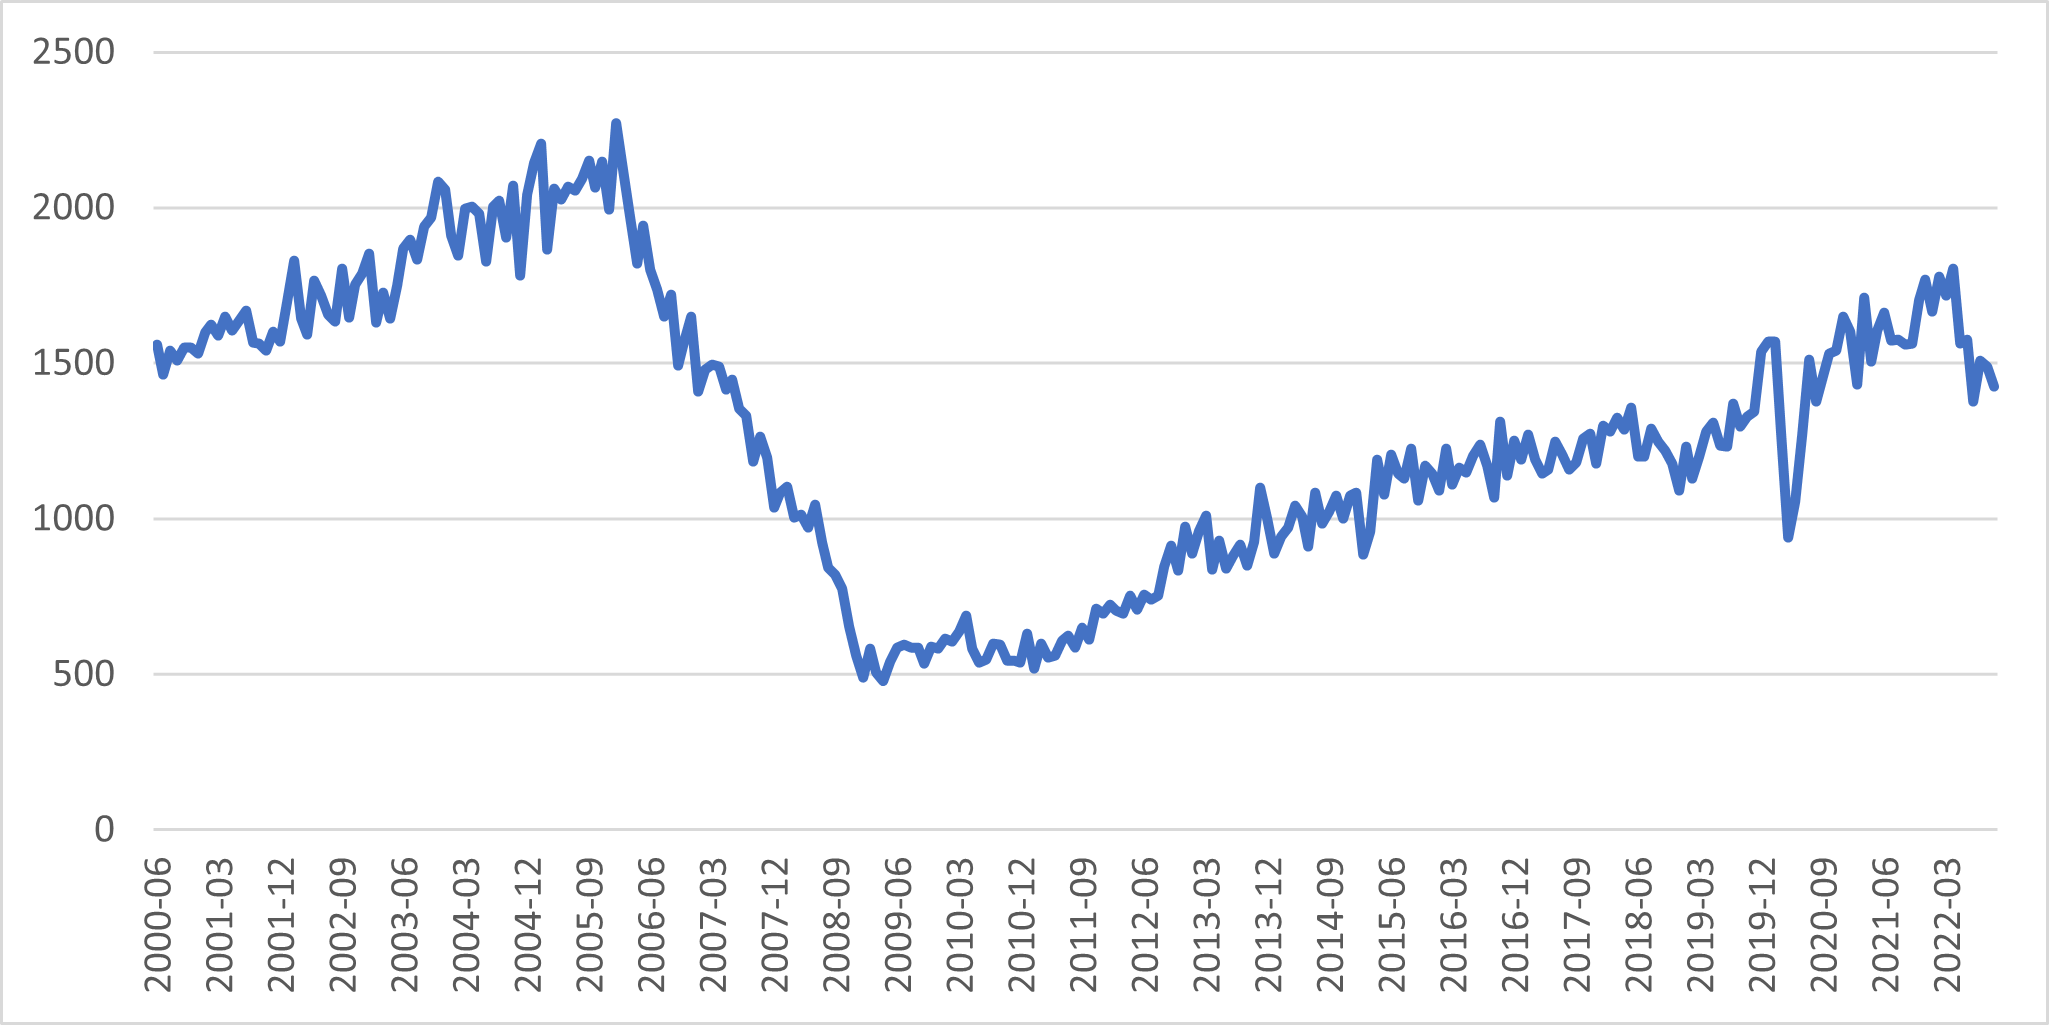
The next indicator we are investigating is the housing starts, which represent an overview of the number of houses started to be built in thousands of units. Similarly to the residential construction spending, this indicator has been in a decreasing trend (in this case since April). The indicator has decreased by 21% ever since, which is another worrying sign for the construction market. However, the level of housing starts is still above the pre-COVID level in the latest reading (October 22).
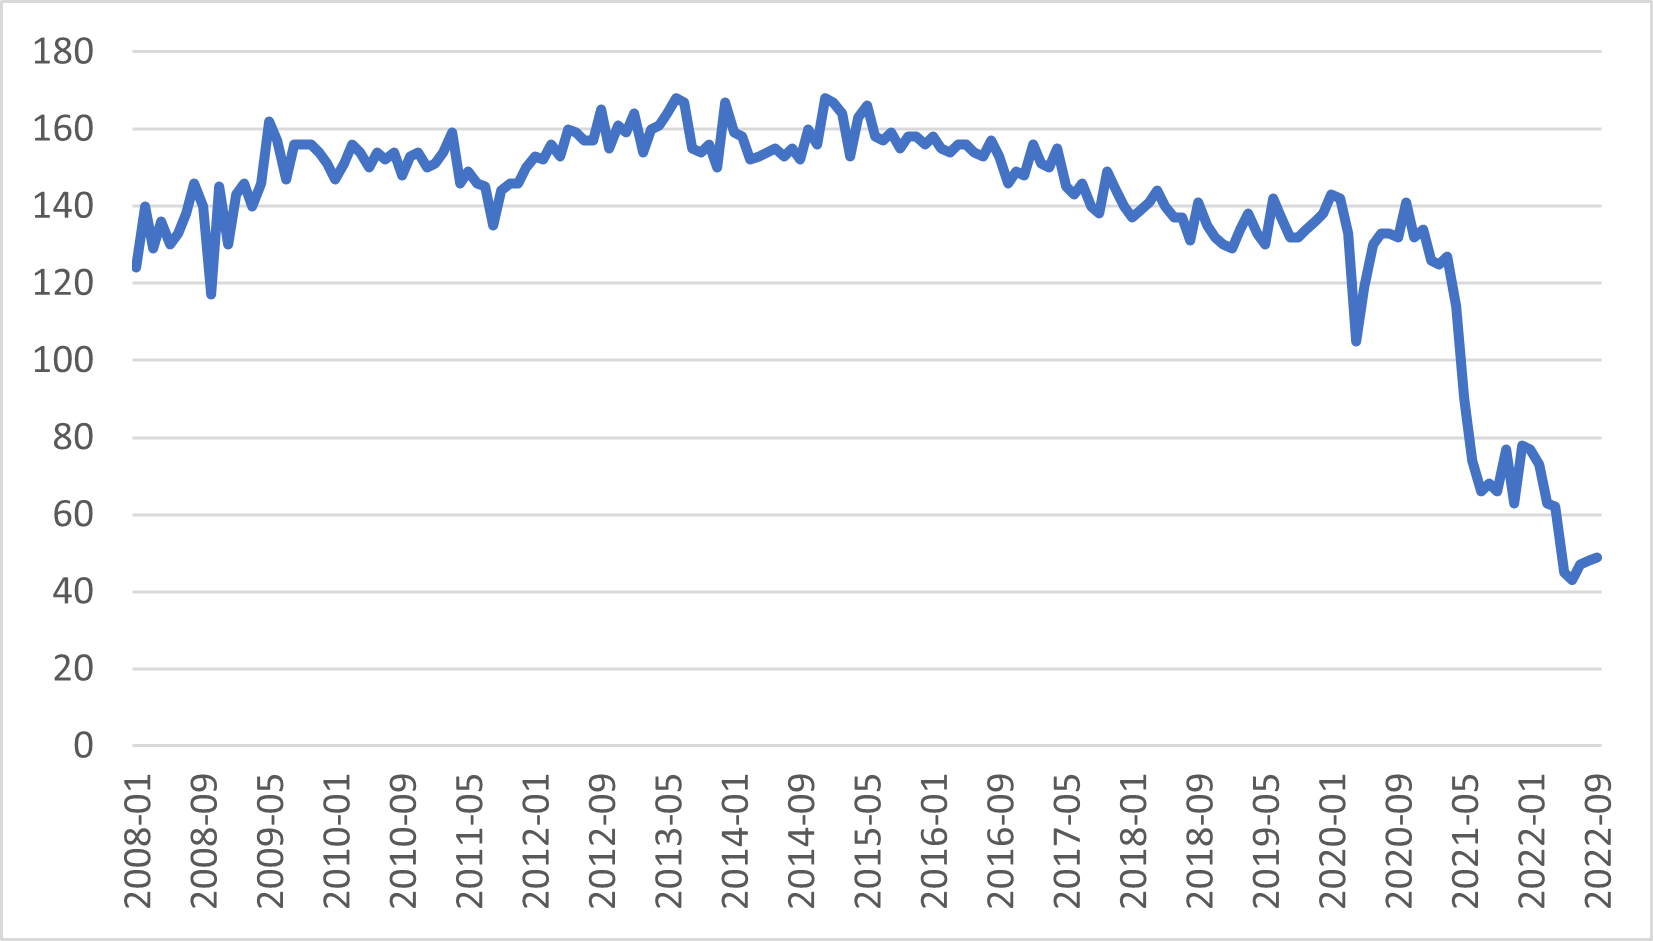
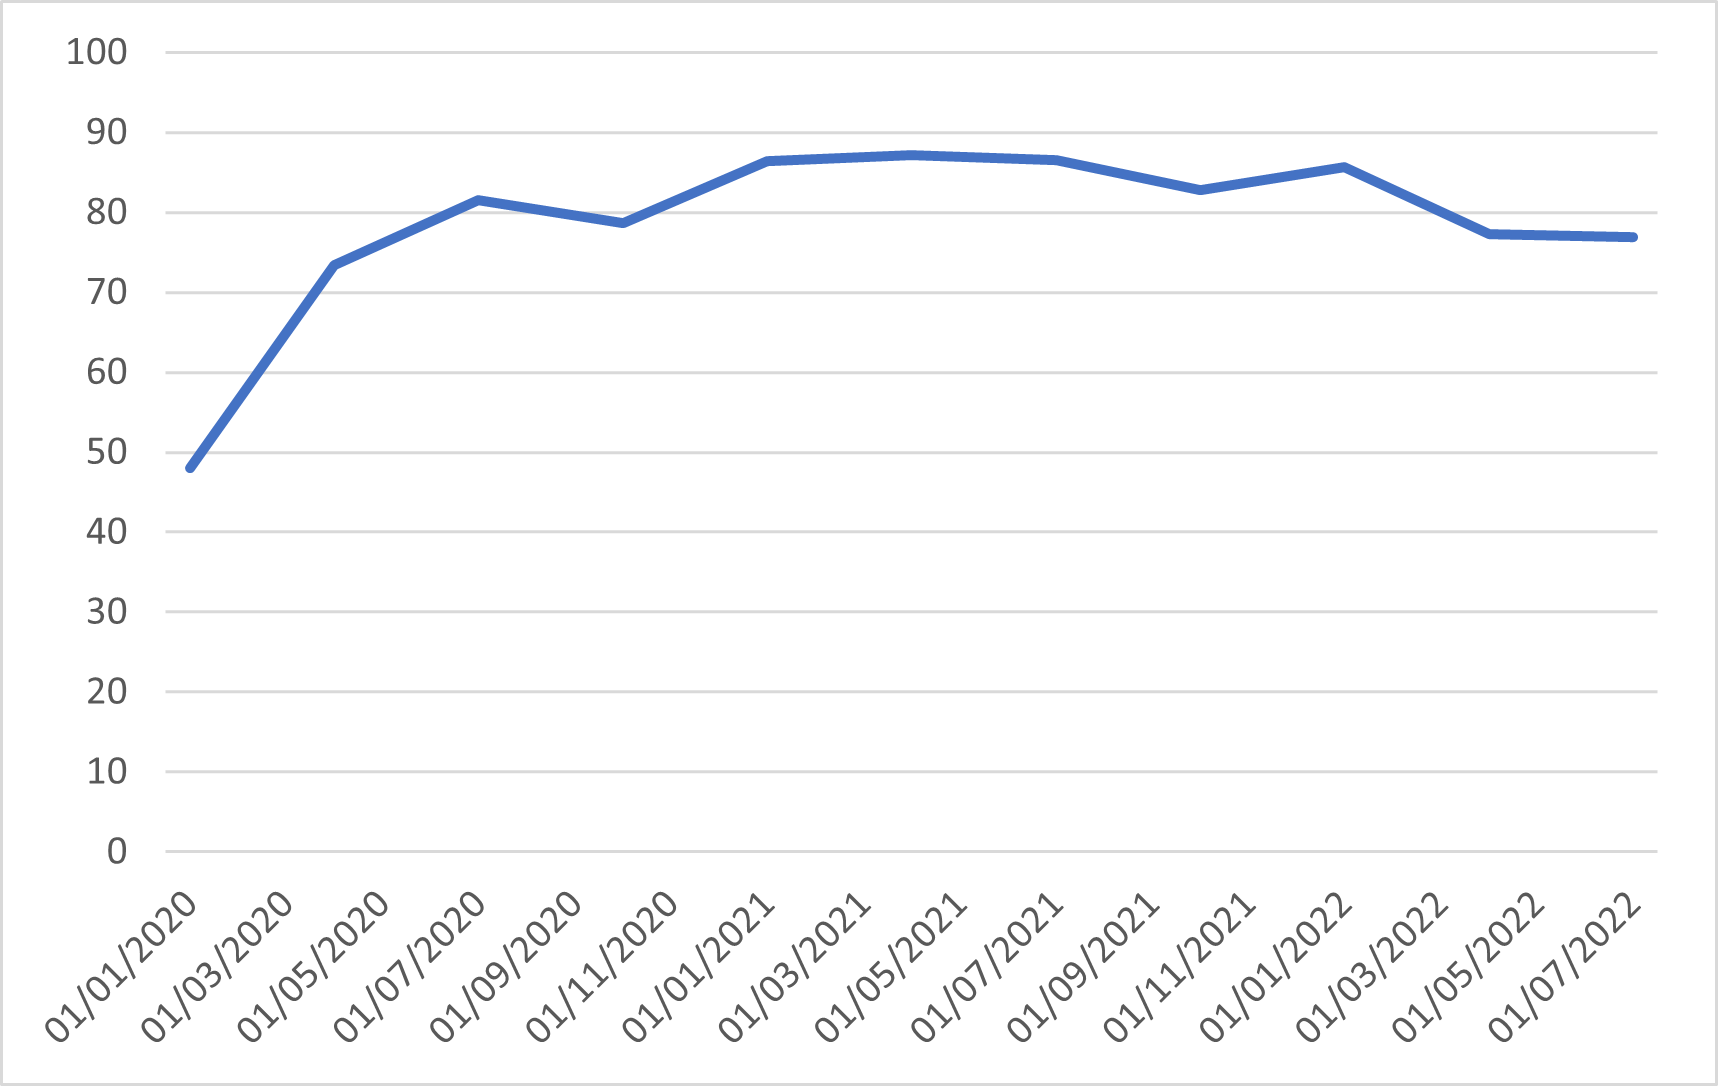
Consumers were also perceiving that the construction sector was overheating. This becomes evident in the University of Michigan's query to consumers. Below is the response to ‘Do you think it’s a good or a bad time to buy a house?’. An indicator value of 100 represents an equal amount of respondents perceiving the current buying conditions as good as they perceive it as bad. Currently, a large part perceives the buying conditions as bad. The indicator started turning negative in May 21 and reached a low (so far) during June. The main reason for such horrible buying conditions is the high prices for homes (although currently, this is decreasing), as well as the increasing interest rates that lead to higher mortgage rates. Currently, there is no outspoken positive reason for buying a house.
In previous indicators, we mainly looked at newly build construction projects. An interesting indicator that offers insights on remodeling is the NAHB US Remodeling index. This indicator captures the sentiment of remodelers where the 50 value represents the equilibrium between optimistic remodelers and pessimistic ones. In the (quarterly) indicator we see that remodelers are for the most part positive about the market situation, although the situation has slowed down since Q2 of this year.
The signals above clearly show that the construction market is slowing down from the 2021 levels. Some indicators are only slightly lower, while others are showing more sizeable reductions. Where are we heading in 23? Let’s look at some more forward-looking indicators.
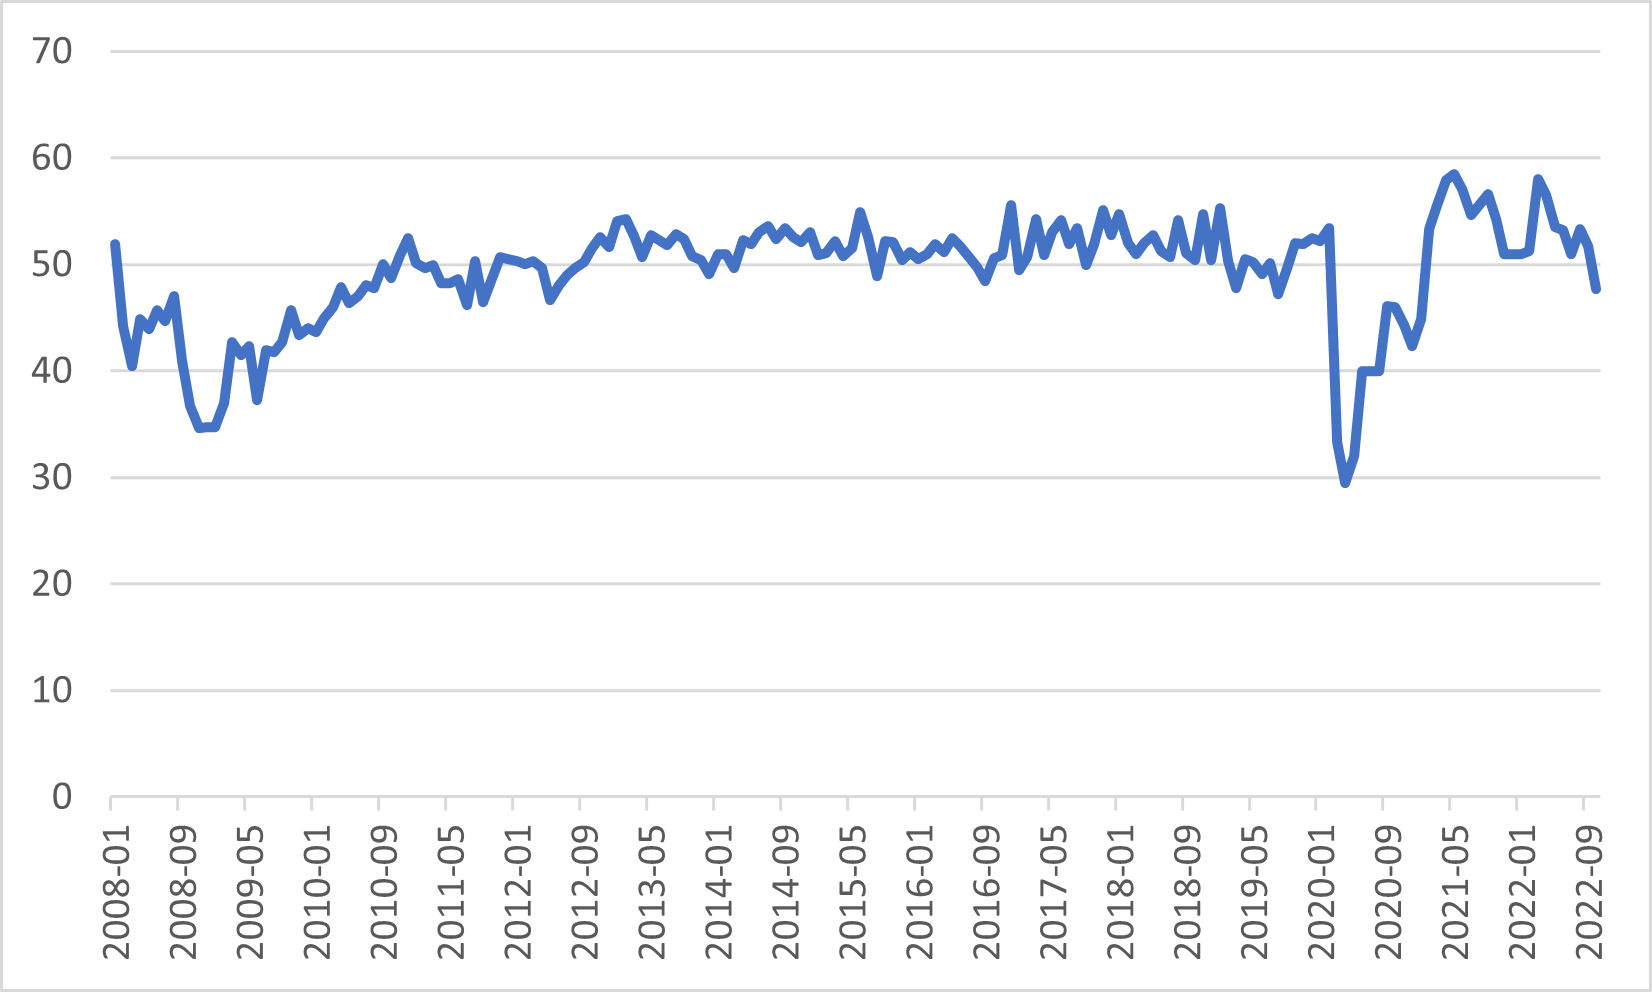
One of the most forward-looking indicators we follow in the construction industry is the AIA architectural billings index (ABI). The ABI is an indicator for nonresidential & multi-family residential construction activity, with a leading value of approximately 9–12 months. The huge leading value is due to the fact that architectural work occurs at the start of construction projects. The architectural billings index is captured by querying associated architectural firms whether their billing activity for the previous month grew, declined, or remained flat. The indicator is interpreted as follows: if the reading is above 50, it shows the billing activity is increasing. If it is below 50, billing activity is decreasing. The ABI shows that billing growth slowed down since May, and turned into reduction of billings in the latest reading of October. This is an indication that future slowdown in nonresidential & multi-family residential construction activity can very well be the case.
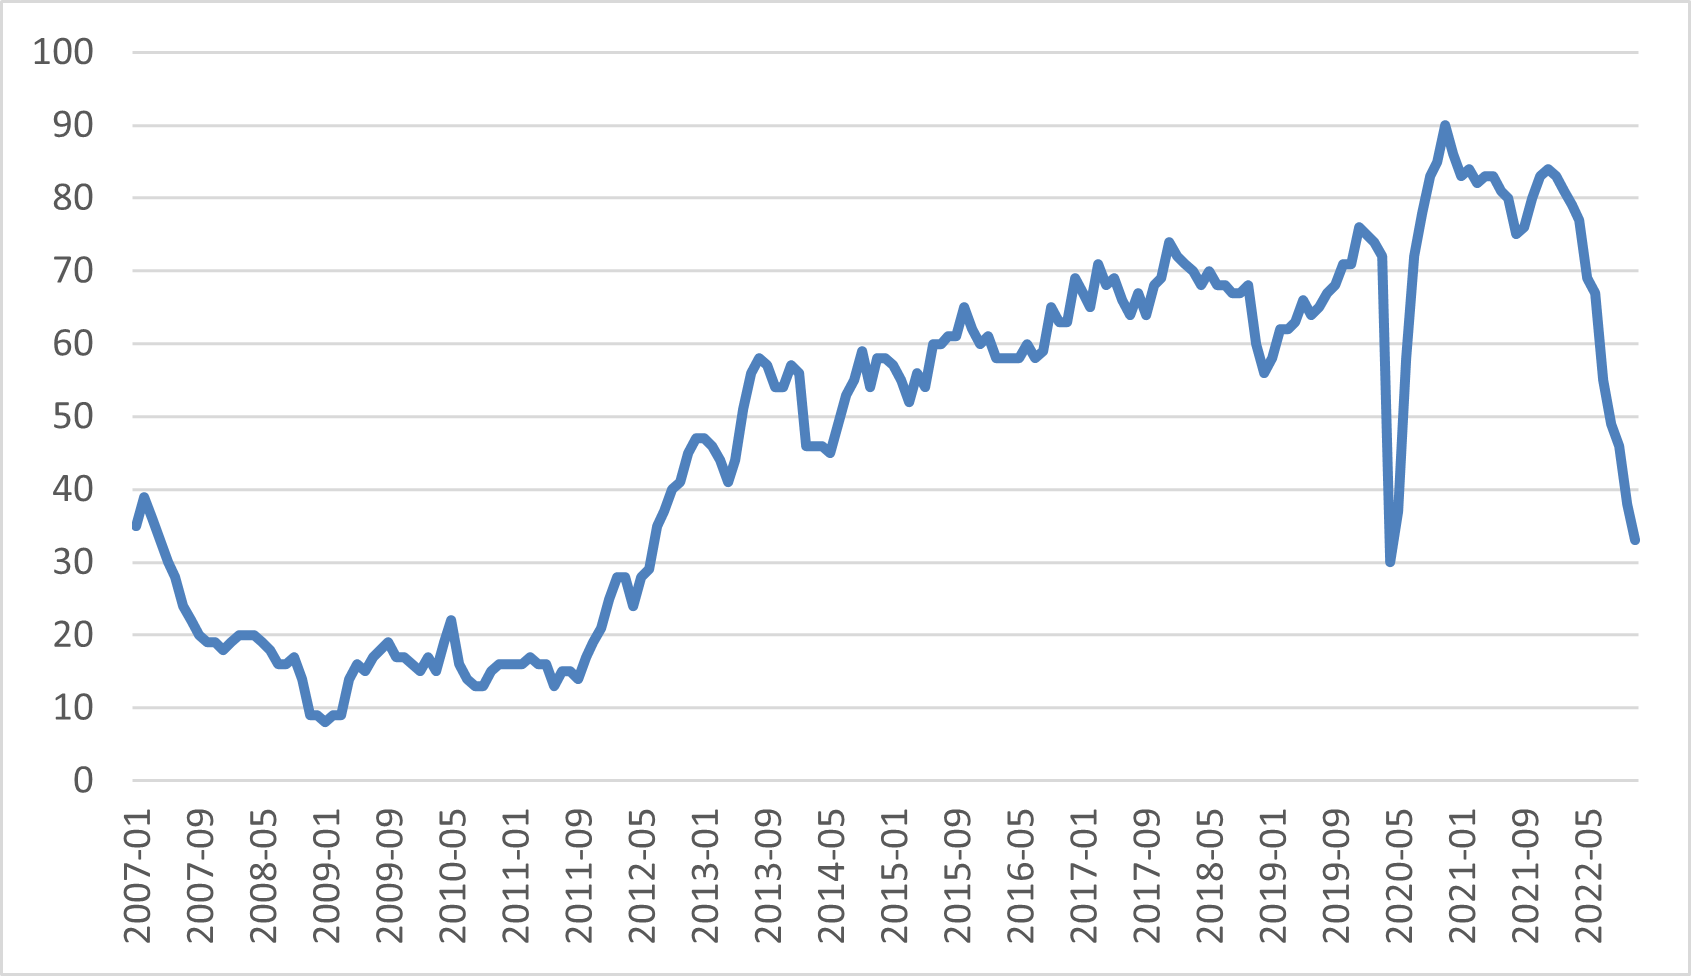
Where the architectural billings index queries the nonresidential & multi-family residential construction activity, the NAHB/Wells Fargo Housing Market Index (HMI) queries the outlook on the single-family housing market. The survey asks respondents to rate market conditions for the sale of new homes at the present time and in the next six months as well as the traffic of prospective buyers of new homes. The weights attributed to the different questions in the query are optimized to provide maximal predictive ability with housing starts of the next 6 months. The indicator does not show an optimistic outlook: the indicator has been rapidly decreasing since December 21 (also showing the leading value of the indicator). On a positive note, the indicator has not (yet) reached the lows that were seen during the financial recession in 2008.
After the strong growth the construction sector saw in 2021, 2022 has been a weaker year in construction. The outlook for 2023 suggests we will see further hardship in the upcoming months. We even know of companies holding back investments because of a potential downturn in the near future. However, monitoring the situation month-over-month is critical to keep a good insight in the evolutions across the construction end-markets. It’s wise to select of the most relevant indicators for your position in the value chain. Monitoring tools from Solventure LIFe collect the different indicators from public and private sources and visualize these in a convenient and intuitive way.
Solventure LIFe also assesses how your company sales are correlated with different indicators and which indicators demonstrate a leading behavior on your sales. These insights allow companies to make a forecasting model that includes evolutions from macro-economic & industry indicators. Companies create a competitive advantage to drive the discussion as part of their Demand Review Meeting (DRM) why the bottoms-up sales forecast aligns or deviates from a macro-economic forecast including these indicators. When inflection points in company sales occur, these models give early warning signals 4 to 6 months in advance. Which sales, marketing or supply chain leader would not hugely benefit of 4 to 6 months of time to anticipate on significant demand changes?

The following articles may also be interesting for you: