


In March and April 2020, global economies have experienced an unprecedented global decrease in economic activities due to partial or full lockdown measures as a consequence of the corona virus outbreak. By the summer of 2020 the very worst of this economic shock appeared to be behind us as economies seemed gradually recovering, and overall retail spending (with a shift from brick-and-mortar to on-line platforms) remained robust. However, unemployment risk is a big issue and the difference between main street and Wall street is striking as US stock markets are approaching near-record levels driven by the Big tech capitalizations. Part of the recovery is attributed due to quick and unprecedented response of central banks and – for some economies – government interventions in employee salary payment in order to avoid a collapse of purchasing power. Some economists say the real recession is yet to come as they are unsure what the long-term consequences of central bank stimulus and the COVID-19 virus will be. So still a lot of uncertainty going on.
For companies it is important to monitor for changes in the business climate. One way to do this is early detection and increased responsiveness to changes in demand for goods or services. However, if we wait for changes in the demand to happen, we will not be able to anticipate on these changes leading to either many missed sales or an unnecessarily high level of inventories. A proven way of anticipating on changes in the business climate is through the use of leading indicators. These indicators fluctuate before changes in our demand will happen, which leaves us time to adjust processes and the focus of our resources. In the remain part of the article we will discuss some relevant indicators to monitor.
Consumer spending comprises 70% of US GDP. In the EU, total household expenditure amounted to 54.3% of GDP. When the economic outlook is favorable, consumers are more likely to spend money on goods. This is especially true for big-ticket items such as a new car, expensive electronics or activity in construction (buying a new home or renovating your existing home). For many businesses, it makes sense to track consumer sentiment/confidence. Typically, this is tracked by surveys to households.
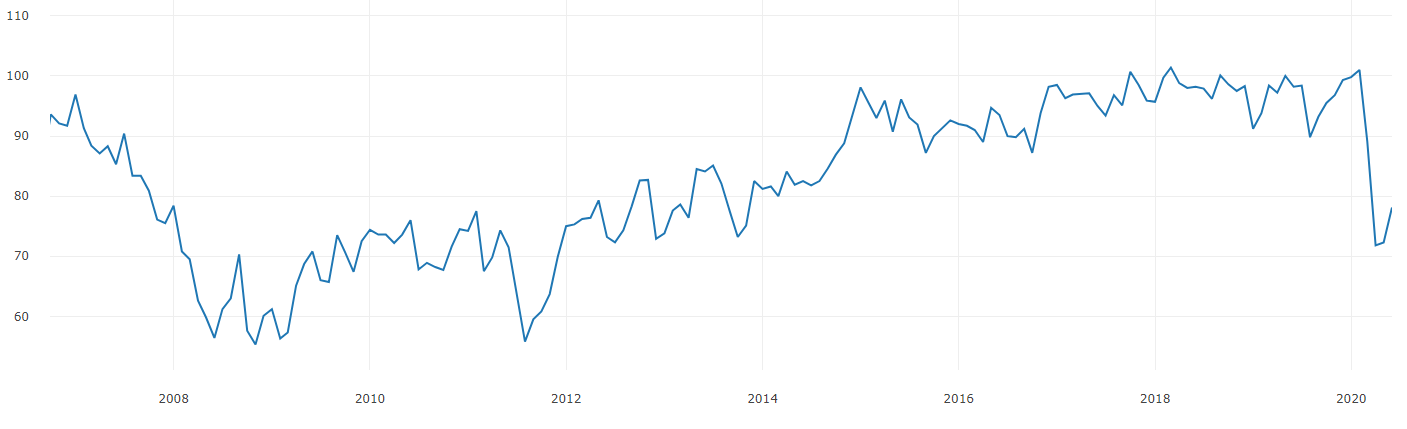
Figure 1: University of Michigan: consumer sentiment during the Global Crisis and now
Manufacturing activity is another important indicator of the state of the economy. Manufacturing activity influences the GDP strongly; increases in manufacturing suggest either more demand for consumer goods or an expectation of more demand for it in the future. Both suggest the economic situation is improving. Since manufacturing activity typically requires workers, manufacturing activity also boosts employment. Several indicators are available to track manufacturing activity. One of those is the purchasing managers’ index (PMI).
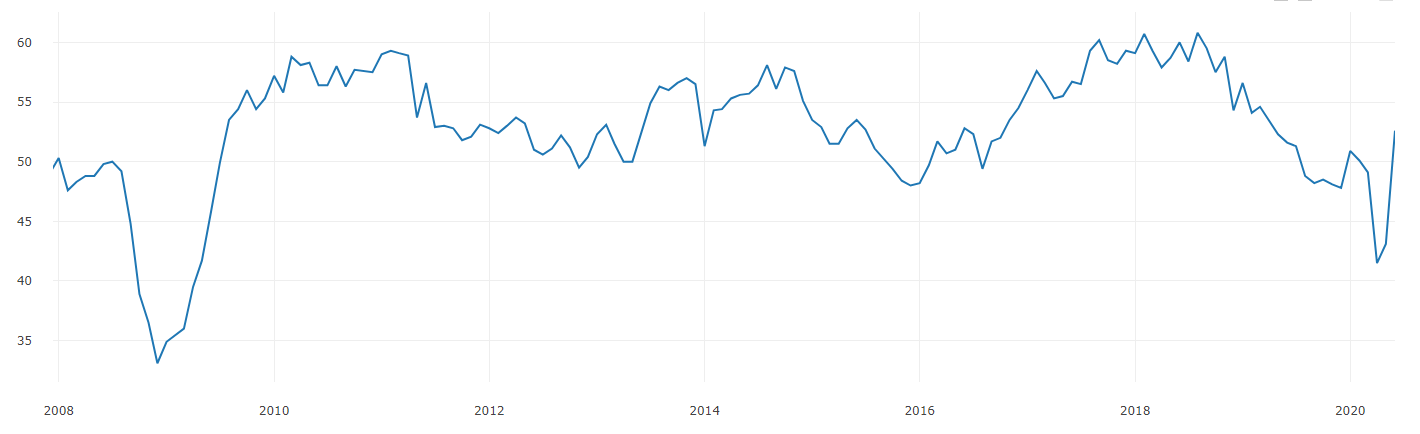
Figure 2: ISM Purchasing managers' index for the US
Related to manufacturing activity is hours worked in manufacturing. When business is improving, workers will typically work longer hours to fulfill (future) demand. When business conditions are deteriorating, workers will work fewer hours. Should the deteriorating persist, employers will typically cut jobs, which will affect sentiment.
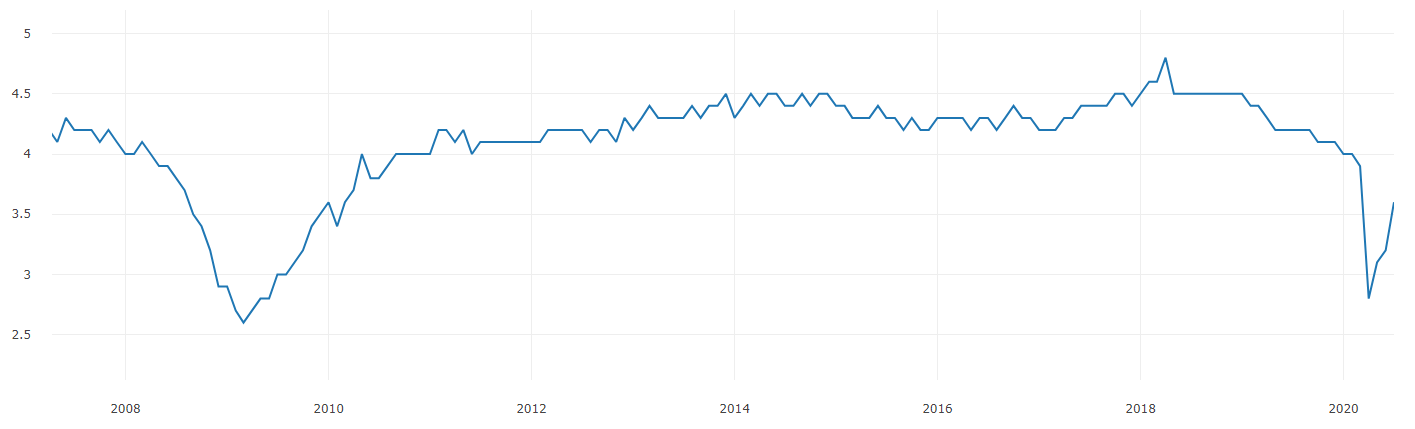
Figure 3: Weekly Overtime Hours: Manufacturing (US)
The Weekly Economic Index (WEI) is a composite index of economic activity, combining the impact previously discussed sectors on the scale of the GDP in the US. The index covers ten different daily and weekly series covering consumer behavior, the labor market, and production. The WEI is interpreted as the four-quarter GDP growth rate. If the WEI reads -10 percent and persists for an entire quarter, we could expect GDP that quarter to be 10 percent lower than a year before.
The 10 weekly economic indicators it includes are: Redbook same-store sales, Rasmussen Consumer Index, new & continued claims for unemployment insurance, adjusted income/employment tax withholdings, railroad traffic originated, the American Staffing Association Staffing Index, steel production, wholesale sales of gasoline, diesel, and jet fuel, and weekly average US electricity load.
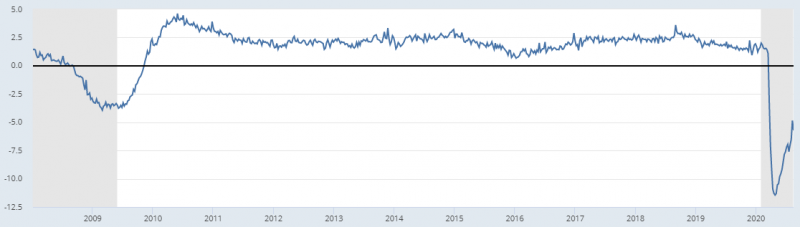
Figure 4: Weekly Economic Index (US)
Previously discussed indicators are goods measures for overall business performance. Each of our businesses is impacted by its own set of indicators. Identifying leading indicators is essential in anticipating on changes in the business climate which can indicate downfalls or uplifts in your demand. At Solventure we gather data from various specialist sources and have the capabilities to link this information to your business.
During the first physical lockdown of March and April 2020 all indicators drop to historically low levels. It is by monitoring the indicator behavior after that shockwave and by comparing indicator behavior with other recession times like the GFC that we can learn more about what we are facing in the months to come.

The following articles may also be interesting for you: