


To bring a cycling race to a good ending, it takes more than good legs. A rider must be able to think strategically and be aware, at all times, of his position, that of his team and that of his challengers. Actually, this is no different for the Sales & Operations Planning (S&OP) process in companies. Supply Chain should adhere to the strategic business objectives, know how they can contribute to this through strategy-driven S&OP and how they can correctly measure themselves against their competitors.
We endorse the strategic model of Treacy & Wiersema (1995) who argues that market leaders pursue one of three strategies:
The different company strategies lead to different supply chains. An opex player, for example, will have a more basic set of services in order to ensure the lowest cost and lowest price.
We use the Supply Chain Triangle of service, cash and cost theory, developed by Prof.dr. Bram Desmet, to challenge the organization and ensure balanced decision-making, accordingly to the chosen strategy. In short, the Supply Chain Triangle concept comes down to the fact that organizations deliver different types of service to their customers, which come at a certain cost and require a certain amount of inventory, or more generically, cash (also referred to as the capital employed - the sum of fixed assets and working capital). The balancing of these three sides of the triangle is regarded as the essence of supply chain management.
Moreover, we can map the different strategies on the Supply Chain Triangle. It makes visually clear that different organizational strategies will lead to different supply chain strategies. It also shows that for comparison with other organizations it will not be enough to just look at one single Key Performance Indicator, e.g. the number of inventory turns.
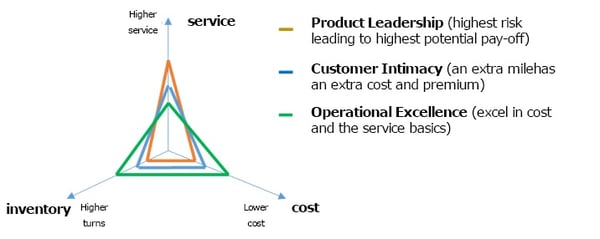
Figure - Mapping Treacy & Wiersema to the Supply Chain Triangle - resulting profiles
A logical next question is how to link the above Supply Chain Triangle concept to financial figures, so it becomes possible to benchmark on a strategic level. Therefore, we use a two-dimensional benchmarking model (see figure below) , whereby dimension 1 is a translation of the service and cost side, and dimension 2 represents the cash side. Possible financial metrics for dimension 1 are gross margin, EBITDA, EBIT and net profit. For dimension 2 these are inventory turns, the cash conversion cycle (CCC) and the fixed asset turns.
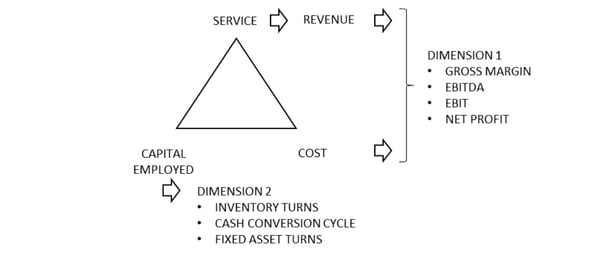 Figure - Possible metrics for two-dimensional benchmarking
Different strategies are different paths to create profit. What organizations get in return for every invested dollar is expressed as the ROCE (Return On Capital Employed). The ROCE equals the EBIT (Earnings Before Interest and Taxes) over the capital employed. It’s no problem to accept a lower EBIT for a lower capital employed in more commoditizing markets where you need to play on cost. Or vice versa, to accept a higher capital employed for the more high-end niches, but in return for a higher gross profit and a higher EBIT.
Or to express it differently: whereas an opex player focuses on efficiency, thus simplicity, the product and customer intimacy leaders will focus on differentiation, thus more complexity. The extra complexity will drive extra costs and extra capital employed, be it in the form of inventory or specialized equipment. But, that’s completely ok, as long as those players have a higher EBIT.
In practice we find companies benchmarking inventory turns, without accounting for the EBIT. If you only look at inventory turns, you will most probably find the opex players to be best in class. Losing sight of the bigger picture, will lead to you (or the executive managers within your organization) holding the same targets for your organization. But what if you are a product excellence leader? To say the least, having the same targets as an opex player would be irrelevant and could become downright dangerous for your Supply Chain organization and, as an extension of it, for your entire company.
In part two of this blog we will further explain strategic benchmarking so that you can use it to gain and retain a competitive edge.
Furthermore, we will dive deeper in how to ensure that realistic targets are set.
Can't wait for the next blog to be published?
