


In our previous blog about strategic benchmarking we linked the Supply Chain objectives to the company’s strategy, made clear that the three sides of the Supply Chain Triangle – namely service, cost and cash – should be in balance and we connected those sides to financial figures, allowing you to benchmark on a strategic level. We also stressed the importance of including the strategic angle while benchmarking, and thus not comparing a low-cost player (operational excellence) with a product leader or a company focusing on customer intimacy.
In this part we further explain how to use strategic benchmarking to define strategy-dependent targets for key financial metrics.
In the previous blog we explained that different strategies are in fact different paths to create profit. What organizations get in return for every invested dollar is expressed as the ROCE (Return On Capital Employed). The ROCE equals the EBIT (Earnings Before Interest and Taxes) over the capital employed (sum of fixed assets and working capital).
From an investor’s perspective it’s no problem that an organization needs more capital, as long as it is offset by a higher margin. Or vice versa, a lower margin is OK as long as you can compensate it by employing less capital.
‘Turn’ metrics for the capital employed are ‘inventory turns’, ‘net PPE (Property, Plant, Equipment) turns’ or ‘fixed asset turns. When having lower turns, organizations employ more capital, so consequently the margin should go up. And vice versa. That gives an exponential relationship as showed on the left in the figure below.
If we measure in a different way, for example in ‘DIOH (Days of Inventory On Hand)’ or the ‘CCC (Cash Conversion Cycle)’, we get a linear relationship. This is shown on the right-hand side of the figure. A higher DIOH or CCC means we need more capital, so the margin should go up.
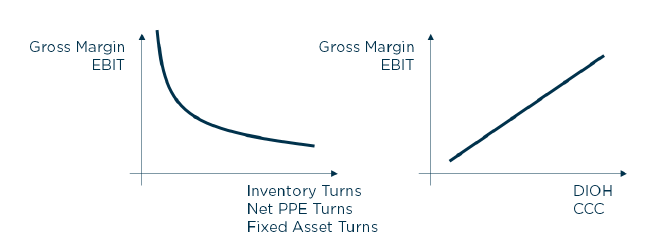
Figure: The Investors’ Indifference Curves
Investors are indifferent on where to be on the curve, as each of the points lead to the same ROCE. The target position on the curve is thereby defined by your chosen strategy. If you are an operational excellence player, you will have a minimal EBIT and a minimal capital employed, whereby the two other kind of market leaders, namely the product leader and customer intimacy leader, will have a higher capital employed and a higher EBIT since they add more complexity to their products or services.
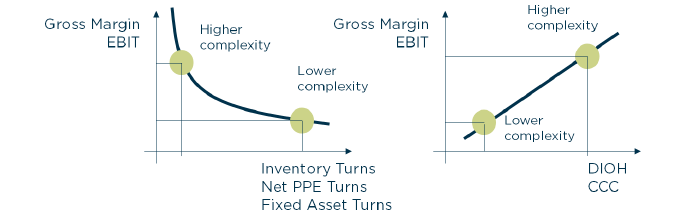
Figure: Impact of strategy on financial metrics
From our benchmarking experiences across multiple industries we match 15% as a standard EBIT level for product leaders, 10% EBIT for a customer intimacy player and 5% for an operation excellence leader. Then we can also translate these EBIT figures into corresponding inventory turns, using the maximum performance curve of a company.
Let’s illustrate the above with a concrete example. In the figure below we compared the 10-year financials of Mattel against four competitors. Each dot corresponds with the result of one fiscal year. The dashed lines show the minimum, medium and maximum Investors’ Indifference Curve for the American toy manufacturer (the higher the line, the higher the ROCE).
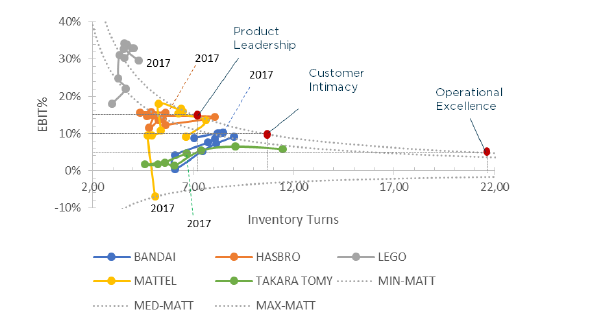
Figure: Benchmarking Mattel against its competitors
Using the maximum performance curve of Mattel to plot the 5%, 10% and 15% EBIT levels results in corresponding inventory levels of 7.1 versus 10.6 and 21.3. Mattel finished 2017 with inventory turns of 5.1 over an EBIT of -7%. The target for 2018 should depend on the chosen strategy. Since Mattel is a product leader, the inventory turns need to improve from 5.1 till 7.1, but the biggest challenge is getting the EBIT from -7% back to 15%. Imagine that Mattel was a low-cost player, then the target would be a 5% EBIT for inventory turns of 21.3.
Mind that targets are sector specific and based on a benchmark. Besides it’s possible to derive strategy-dependent targets for the whole set of ‘turn metrics’ and DIOH and CCC metrics.
We believe that benchmarking is an excellent way of discovering if you are leading in the race, are in the peloton or at the back. Knowing what position you are in can help you decide on your next steps in the supply chain area. The information allows you to identify gaps in your organization’s processes and, finally, to accelerate in order to gain a competitive edge.
To make once more the comparison with the sport of cycling: a real leader will not ride hard constantly with no recovery time, as then he would end up exhausted, not being able to win the sprint anymore. The same is true for companies: once you have chosen your strategy, then stick to it. Don’t let you be distracted by benchmarks of companies with a completely different strategy. Besides, it’s important to set realistic goals. Use the strategy-dependent targets to make ‘piecemeal’ steps. And realistic steps: you could wish to have inventory turns of 21.3 with an EBIT of 15%, but that is not going to happen anyway.
Once you have derived the strategy-dependent targets for a set of key financial metrics, the S&OP process becomes your satellite navigator, or your communication headset if you like, to optimize your race and assure your best place in it.
Want to know more about using strategic benchmarking in order to achieve strategy-driven S&OP? Order here the book ‘Supply Chain Strategy and Financial Metrics. The Supply Chain Triangle of Service, Cost and Cash’, written by our CEO Bram Desmet. Of course, it’s also possible to contact us directly with your questions.