


Energy prices are soaring. Ever since the start of the year, it has been all over the news: energy prices have increased dramatically since the outbreak of the COVID pandemic. This blog post discusses how energy prices impact businesses, how they are measured, and how the market dynamics work. Let’s start with how they impact businesses!
Energy price fluctuations impact businesses in various ways. First of all, we have the direct impact of those fluctuations. Higher energy prices directly impact transportation costs (energy is a key cost component of transportation) and production costs. For example, crude oil is a key raw material for the petrochemical industry and the fabrication of plastics. Additionally, often massive amounts of energy are necessary for sustaining production processes such as in the chemical, metal or cement & lime industries.
Additionally, there is an indirect impact of those fluctuations. Energy price increases tend to increase the general price level of many goods & services. Energy price fluctuations could lead to upstream suppliers having to increase prices to account for those costs. It could lead to downstream suppliers having to increase prices, which can in the end impact demand of your goods. Energy price fluctuations also take big chunks out of a household’s disposable income, leading to a reduced budget for other goods. As an example for the burden on households, the Federal Reserve Chair Powell stated that for every additional 10USD/barrel of crude oil there is a 0.2% impact on inflation.
Typically, energy prices are synonymous for oil prices. Oil is used as a fuel for transportation & heating, but also for asphalt and as a chemical reagent to make plastics, pesticides and pharmaceuticals. Oil prices are expressed in USD per barrel for a certain blend. A barrel contains 42 gallons or about 159 liters. The blend refers to the oil benchmark measuring properties of the extracted oil. Famous light and sweet blends are Brent & West Texas Intermediate (WTI), famous heavy and sour blend include Fateh (Dubai). Given the high degree of substitutability and the relative easiness of transporting crude oil across oceans, oil price are stable globally and a good benchmark for global energy prices.
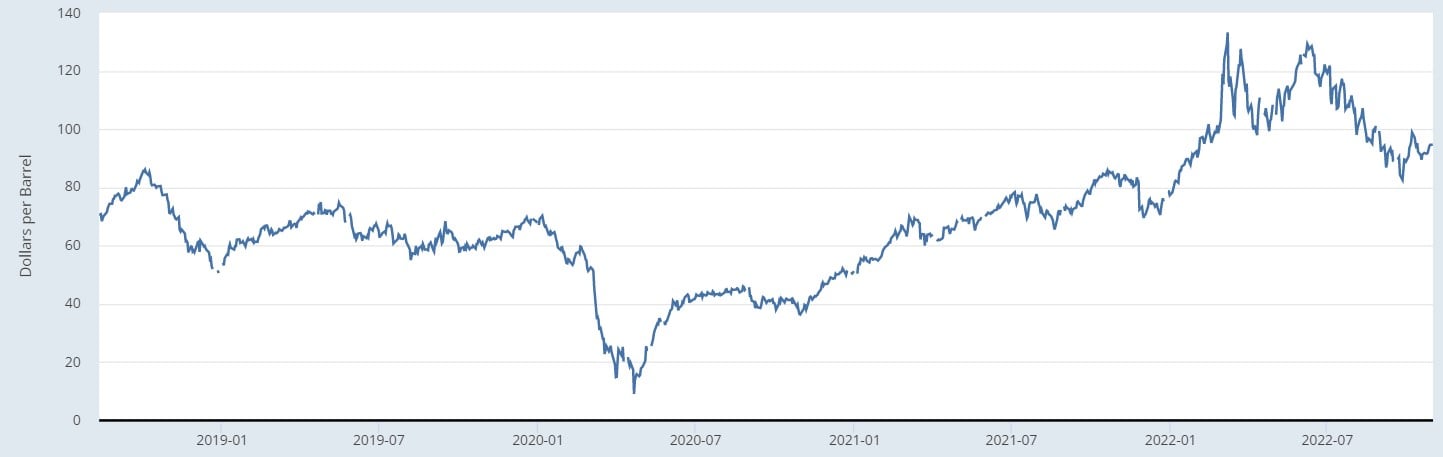
Brent crude oil price increase from pandemic lows below 20USD/barrel to over 130USD/barrel
Another type of energy price that has reached much coverage lately is natural gas prices. Natural gas can be seen as the gas variant of liquid crude oil. The gas is mainly used for heating, cooking, and electricity generation. It can be transported in similar ways like liquid crude oil but requires more complex liquefication to LNG to transport overseas. This can lead to major price differences for LNG between continents. For example at the start of August the Dutch TTF natural gas benchmark (the benchmark for Western Europe) reached a 200 Euro per MW or roughly 60 USD per MMBtu. The Henry Hub benchmark for the US was only 7.75 USD per MMBtu, indicating a 6 to 7 fold premium between Europe and the United States.
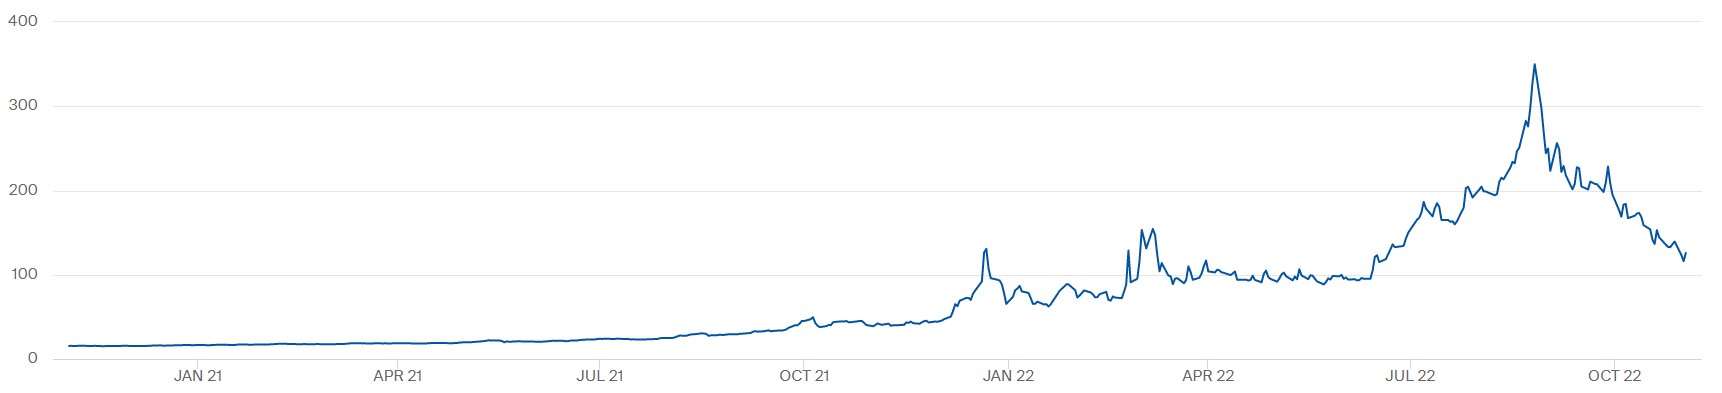
The September future for Dutch TTF gas increased from 27EUR/MW in August 2021 to over 300 in August 2022.
How did we get to such high energy prices? Energy prices are determined by the law of supply and demand. If demand increases, the price will typically increase for a constant supply. If supply increases, the price will typically decrease for constant demand. For energy prices, we will discuss supply and demand dynamics on both the crude oil price, as the natural gas price. Let’s start with the supply side.
On the supply side, there is OPEC+ and non-OPEC+ supply. The non-OPEC+ producers make independent decisions about energy production. They are publicly traded energy companies who seek to increase shareholder value and make investment decisions based on economic factors. They will have to balance distributing cash to shareholders versus investing in future production, which can result in a future uncertain shareholder return. These publicly traded companies regularly publish the amount they will invest in production capacity for the upcoming years, giving insight into future capacity increases.
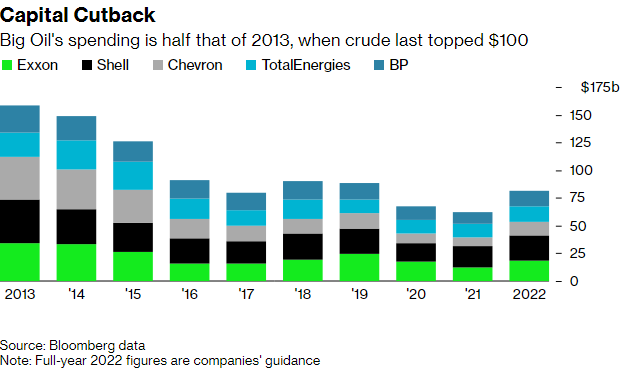
Big Oil spending increased in 2022, yet is still much below 2013 spending when the oil price last reached 100USD/barrel
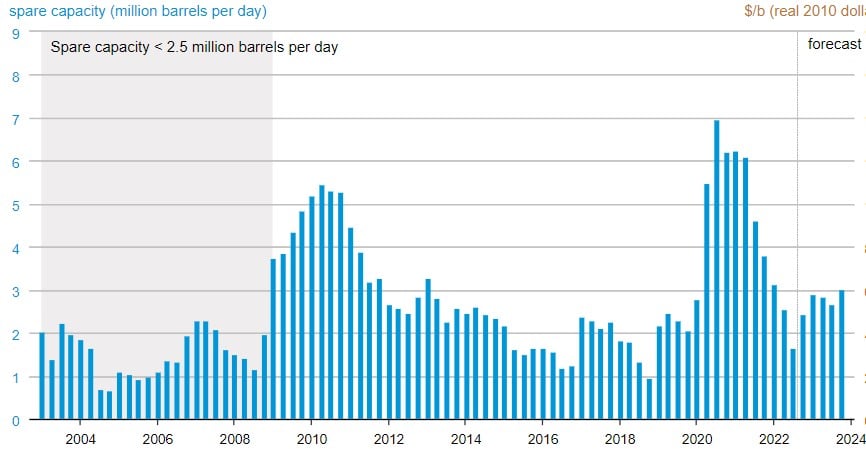
On the OPEC+ side, supply is centrally decided within the OPEC+ group. The group manages the oil production of its members by setting production quotas based on production capacity. It’s very interesting to monitor the capacity, production, and quota for major OPEC+ players such as Saudi Arabia & Russia. For example, Saudi Arabia has a theoretical capacity & current quota of 11M barrels of oil/day, leaving very little room for supply increases to push down prices. The figure below summarizes the OPEC spare capacity. Currently, the group has 2.5-3M spare capacity, although most of the spare capacity originates from sanctioned Iran, which limits the group’s ability for influencing price decreases.
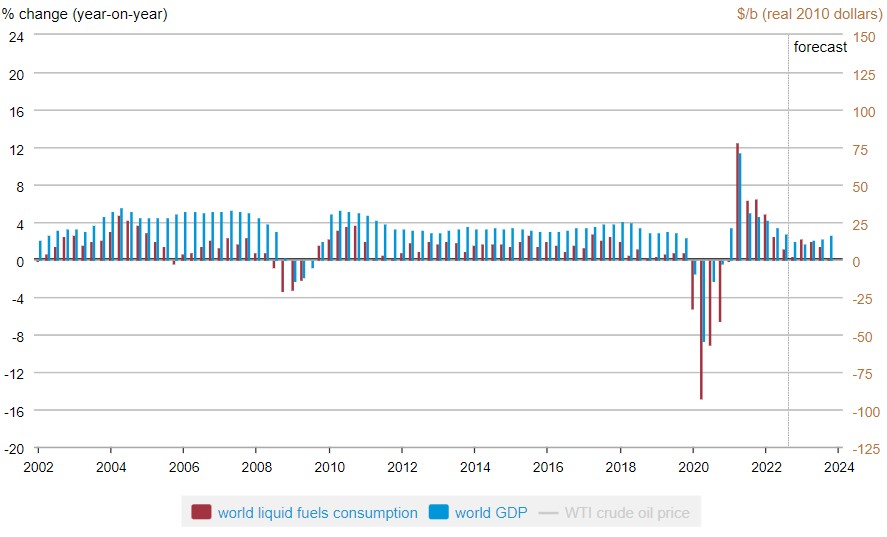
The demand for oil is strongly influenced by economic growth. Higher economic growth tends to increase the need for energy products. During economic prosperous times, the industry will increase production and consumers will drive their vehicles more often. The figure below shows the strong link between economic growth (blue) and fuel consumption (red).
Finally, there is the aspect of uncertainty on both the demand & the supply side. On the supply side, the supply from Russia has been highly uncertain due to Russia’s invasion of Ukraine. Gas throughput in the North Stream pipeline has reduced to 0 as the pipeline has been sabotaged. The EU will ban the imports of Russian oil at the year-end. It is highly uncertain whether the reduced energy flows from Russia to Europe can be sent to other regions, as well as potential future declines and sanctions that can further impact supply.
On the demand side, the economic growth outlook has been highly uncertain. Growth expectations have been cut from the start of the year. Economists are debating whether there is/will be a recession. This creates uncertainty about future demand for energy products.
Monitoring the situation month-over-month is critical to keep a good insight into the evolutions. Monitoring tools from Solventure LIFe collect different indicators from public and private sources in a convenient way and will help you in assessing future evolutions for energy prices, but also for many other impact drivers such as your end-markets and your raw materials.
Solventure LIFe also assesses how your company sales are correlated with different indicators and which indicators demonstrate a leading behaviour on your sales. These insights allow companies to make a forecasting model that includes evolutions from macro-economic & industry indicators. Companies create a competitive advantage to drive the discussion as part of their DMR of why the bottoms-up sales forecast aligns or deviates from a macro-economic forecast including these indicators. When inflection points in company sales occur, these models give early warning signals 4 to 6 months in advance. Which sales, marketing, or supply chain leader would not hugely benefit from 4 to 6 months of time to anticipate significant demand changes?
Has inflation reached its peak? What can you do to handle these inflationary times?
Discover it by watching the webinar on demand: Inflation: will it persist over 2023? Where we discuss the current status and outlook for the future. Additionally, discover how predictive analytics and external data can help you to handle these inflationary times!
