


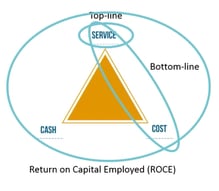
Sales & Operations Planning (S&OP) is about balancing the supply chain triangle of service, cash and cost, and thus optimizing the shareholder value by maximizing the Return On Capital Employed (ROCE). But which metrics should you apply in order to ensure your Sales & Operations Planning meetings are efficient?
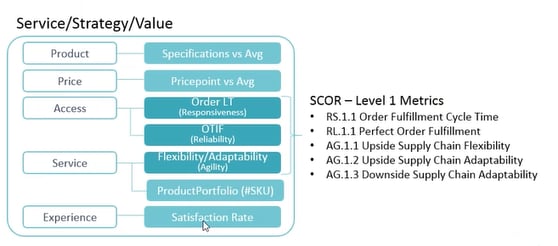
Many supply chain organizations determine their Key Performance Indicators (KPIs) on the basis of the Supply Chain Operations Reference (SCOR) model. This is the world’s leading supply chain model, linking business processes, performance metrics, practices and people skills into a consolidated framework. Yet there are several reasons why the SCOR model, in my opinion, is not always the right starting point.Let’s look more closely at one of the three corners of the supply chain triangle, namely service. The SCOR model rates a company’s service level using so-called ‘level 1 metrics’, in particular the Order Fulfillment Cycle Time, Perfect Order Fulfillment, Upside Supply Chain Flexibility, Upside Supply Chain Adaptability and Downside Supply Chain Adaptability. Those KPIs are clustered around three main themes: responsiveness, reliability and agility. However, I consider the service dimension to be incomplete in this set of metrics.
In my strategy and coaching sessions I use the model by Treacy & Wiersema, who conducted research into what drives success. According to them, it’s clear that companies who consistently outperform their competitors have chosen to focus on one of three defined leadership values: product leadership, customer intimacy or operational excellence (focusing on low costs). Besides that, market leaders are extremely disciplined in executing the strategy of their choice.
The strategic focus they choose has a significant impact on their supply chain decisions. For example, a leader in customer intimacy will have a broader product range, which leads to higher inventories and a higher cost position. In my view, the SCOR metrics don’t allow organizations to translate their strategy into relevant KPIs, even though the strategy has a big impact on cost and cash.
So how can we model strategic trade-offs in the Sales & Operations Planning meetings? To do this at Solventure we use the model by Crawford & Mathews, who maintain that companies’ value propositions are typically based on five dimensions: access, experience, price, product and service. We’ve created a model in which we complement the service dimension with the above-mentioned value propositions (Figure 1).
I’m convinced that if you want to model strategy you will need a richer definition of the service angle than the SCOR model offers. Moreover, you can extend the same logic to the other two corners of the supply chain triangle: cost and cash.
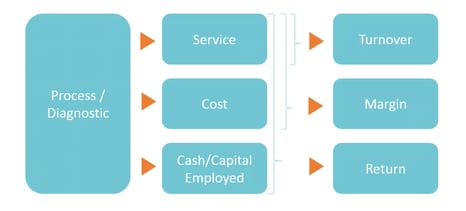
Service is a top-line driver. Combining the top line with cost will give you the bottom line. If you look at the bottom line generated over the cash/capital, you will get metrics that reflect the return. When building a metrics dashboard, it’s crucial to measure each of the individual sides of the supply chain triangle to check the combined metrics.
One thing I do like about the SCOR model is the diagnostic metrics or process metrics (e.g. number of components, promos, forecast bias, number of order lines, etc.). Where should we place the forecast accuracy, for example? Is it a service, cost or cash metric? Actually, I prefer to see it as a kind of diagnostic metric. You know that improving your forecast accuracy will improve your service, lower your cost and enable you to reduce your inventory. In general, I believe that the diagnostic metrics work on the various corners of the supply chain triangle at the same time.
In summary: if you are setting up a metrics dashboard for your S&OP meetings you need to measure your diagnostic metrics, you need to measure the different sides of the supply chain triangle including the value proposition and you need to measure the results, which are a combination of metrics. With those inputs, you can build a dashboard which will give you a complete overview at a single glance.
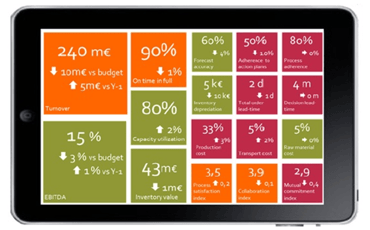
THEORETICAL S&OP DASHBOARD MODEL IN PRACTICE
