Welcome to the second part of our blog series outlining essential additions to your 2024 demand planning enhancement wishlist. After delving into the domain of ML Augmented Statistical Forecasting in our initial segment, we now continue with the next topic: Leading Indicator Forecasting, which entails the exploration of forecasting methodologies utilizing external data sources.
Sales forecasting using external drivers involves analyzing outside factors that can impact sales performance. These external drivers can be economic, market-related, environmental, or influenced by industry trends. Integrating these factors into sales forecasting helps businesses make more accurate predictions. By integrating leading indicators, businesses can anticipate changes in sales and make proactive decisions.

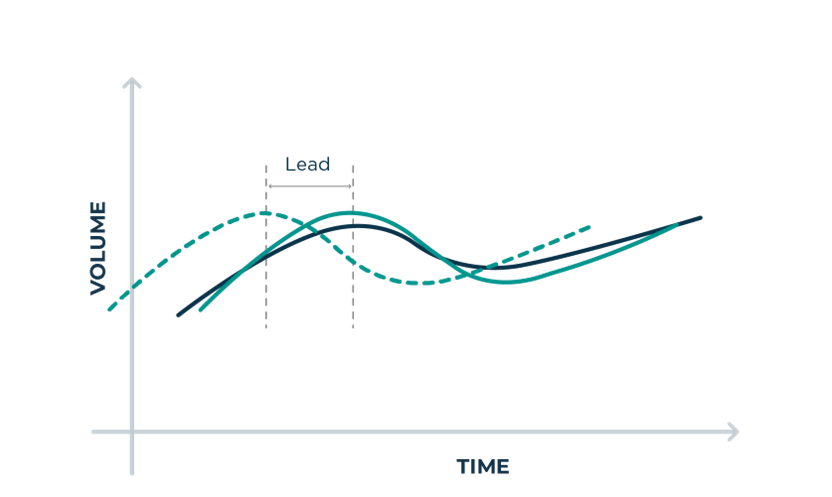
The figure above explains the concept of leading indicators. Either the leading value of the indicator or an indicator with a forecast can be used to predict future sales. These indicators can be macro-economic data, sector-specific data, sector trends, events & legislation. By linking these indicators to sales in a machine learning model, an explicit link is created between both. If changes occur in the indicators, there will be an impact on the sales. Of course, often there is more than one influential indicator which increases the complexity of finding and incorporating indicators significantly.
Leading indicator forecast models are modelled for specific businesses in specific geographical areas. This means you typically shouldn’t apply such techniques on the SKU-customer level as this level is too low. On the other hand, the total business level could be too high. Ideally, it should be linked to a certain application area (think automotive, construction) in a certain region.
How should the output be interpreted? Just like the sales, marketing or other outlook in the demand planning process: it is an additional input. An additional pair of eyes as it were. The sales outlook adds relevant information on new client wins, existing clients up or downscaling, tenders. The leading indicator outlook adds the general market impact on the demand. If automotive sales increase, or if building permits increase then typically we see the demand increase.
We are always happy when clients tell us leading indicator forecasts are similar to the statistical forecast: it means their business is evolving in a continuous trend. When a trend change occurs (the moment where volatility is the highest and when businesses are impacted the most), we see significant added value for leading indicator forecasting. Having insights in business inflection points months in advance is crucial for your business.
Watch now the webinar on demand: Navigating the future: A Deep dive into Leading Indicators via Case studies, with Gylian Verstraete, Manager Data Science at Solventure and Gustavo Escobar (Manager at Miebach Consulting Group)
The following articles may also be interesting for you:
These Stories on External data