


A forecast is always wrong. That is the first thing we learned when we were taught the principles of forecasting. Knowing it will always be wrong, it becomes a real challenge to get it as good as possible. How can we do that efficiently & effectively?
Forecasting is all about balancing the demand and supply of our products. If we are able to balance this correctly, our life would become so much easier. The following paragraphs will guide you through some of the do’s and don’ts of forecasting. Are you ready?
One of the main challenges today is that companies not always take the time to thoroughly analyze the current “as-is” situation and immediately start looking on how they can improve their process without clearly defining where the gaps are and where improvement can be made.

Let that thorough deep-dive be the key to a good start of an improvement journey. So let’s start with having a closer look on the situation your company is currently in.
Segmentation is the start of better understanding your product and customer portfolio. By segmenting, you easily focus on the right products and customers to increase overall customer satisfaction. You can segment based on volume, margin, demand pattern, variability etc.
If this segmentation is done properly, the statistical forecast module can rely on a solid base and improve the overall forecast accuracy. By segmenting your data structure, you can prioritize the items on which you need to invest time.
Another tricky question is, on which level and in which time bucket will we forecast with the best accuracy? By performing a variability and pareto analysis on different levels you can detect the best possible forecasting level for your company. In picture 1, we can see that a lot of products are located in the A class, high variability group. As we cannot accurately forecast those items we should search for another level of forecasting. When we aggregate our data to SKU-Selling Plant, we notice a shift towards the A class, low variability group. Due to this analysis we can conclude that forecasting on SKU – SellingPlant adds the most value.
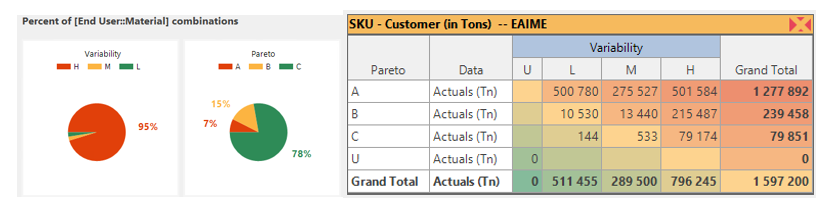
Picture 1: Customer - SKU combinations
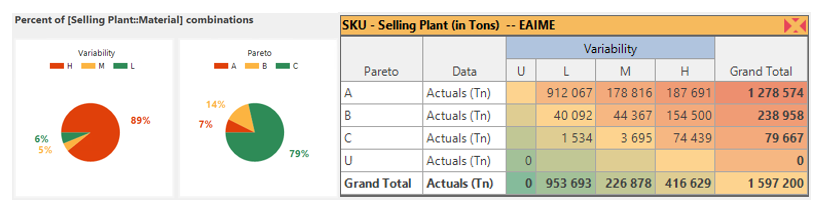
Picture 2: Customer - SellingPlant
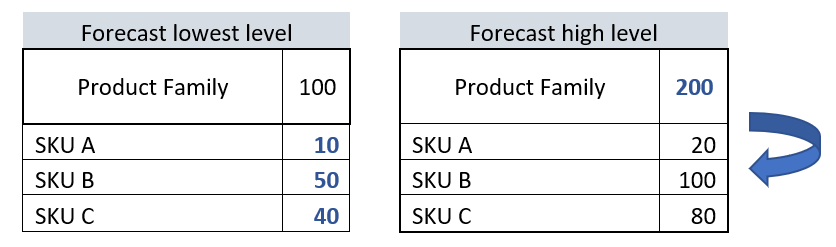
The forecast on a higher level, the level that has the most forecast accuracy, should drive your overall statistical forecast value. By calculating the forecast on the lower level you can correctly disaggregate the forecast on the higher level to the lower level based on the below ratio.
Short example:
Another way to improve your overall forecast accuracy is segmenting your portfolio based on demand patterns. See the lumpy demand in Figure 3, I can imagine that you do not want to forecast this form of erratic demand.
If you use the Lewand forecasting technique, the model will try to predict the demand peaks for the future. For this demand you might prefer an average model instead of a model that tries to fit the erratic demand.
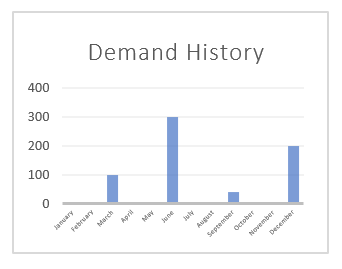
Figure 3: Lumpy Demand
In Arkieva - the software tool we use to forecast demand – a set of forecasting techniques compete. Arkieva will pick the method with the smallest error. By segmenting our portfolio based on demand patterns we can filter in the pool of forecasting techniques that will be put into competition. For really erratic demand we do not want to use the complex forecasting techniques to avoid overfitting.
Not only internal insights can be used to forecast the future. By using LIFE (Leading Indicator Forecasting), you can visualize and react to external impacts and trends. Changes outside your company will finally become visible into your forecast. Imagine that your company is influenced by the weather or by oil prices. By including these global and external trends, you are able to detect what is driving your demand and proactively react to changes in the market! This whitepaper tells you more about including external information in the forecasting process.
More than often we see that companies have the right tools and processes in place, however still the planning process is not operating as it should be. As a business it is not only important to have the right tools, analytics and processes... this will not work only on its own. A very important pilar in the process are the people. There are a few key understandings to take into account:
Last but not least sales can add their knowledge. By letting sales people and other people with business knowledge drive the consensus forecast, everybody in the company can include their extra insights. Collaborative forecast will drive cross departmental communication and stimulates the company to strive for a uniform goal.
Everybody needs to be aware that the statistical forecast is not the only part of the S&OP process. It forms the interconnectivity between the different steps in the S&OP process and drives the outcome of the demand planning process. Let’s say, it’s all about balancing demand and supply, right?
Curious for more?  about how we tackle demand management in this whitepaper.